Spectrophotometry vs. Visual Assessment in Textile Conservation
Two Tools, Two Questions
Ask a group of textile conservators whether they prefer spectrophotometry or visual assessment for color matching, and you will get a lively debate. The instrument camp argues that objective measurement removes human bias. The visual camp counters that no instrument can judge how a repair will look in a gallery.
Both sides are right, because they are answering different questions.
Spectrophotometry answers: "Are these two colors measurably the same?" Visual assessment answers: "Will a museum visitor notice the repair?"
These are not the same question — and understanding the distinction is essential for effective color matching in conservation.
How Spectrophotometry Works
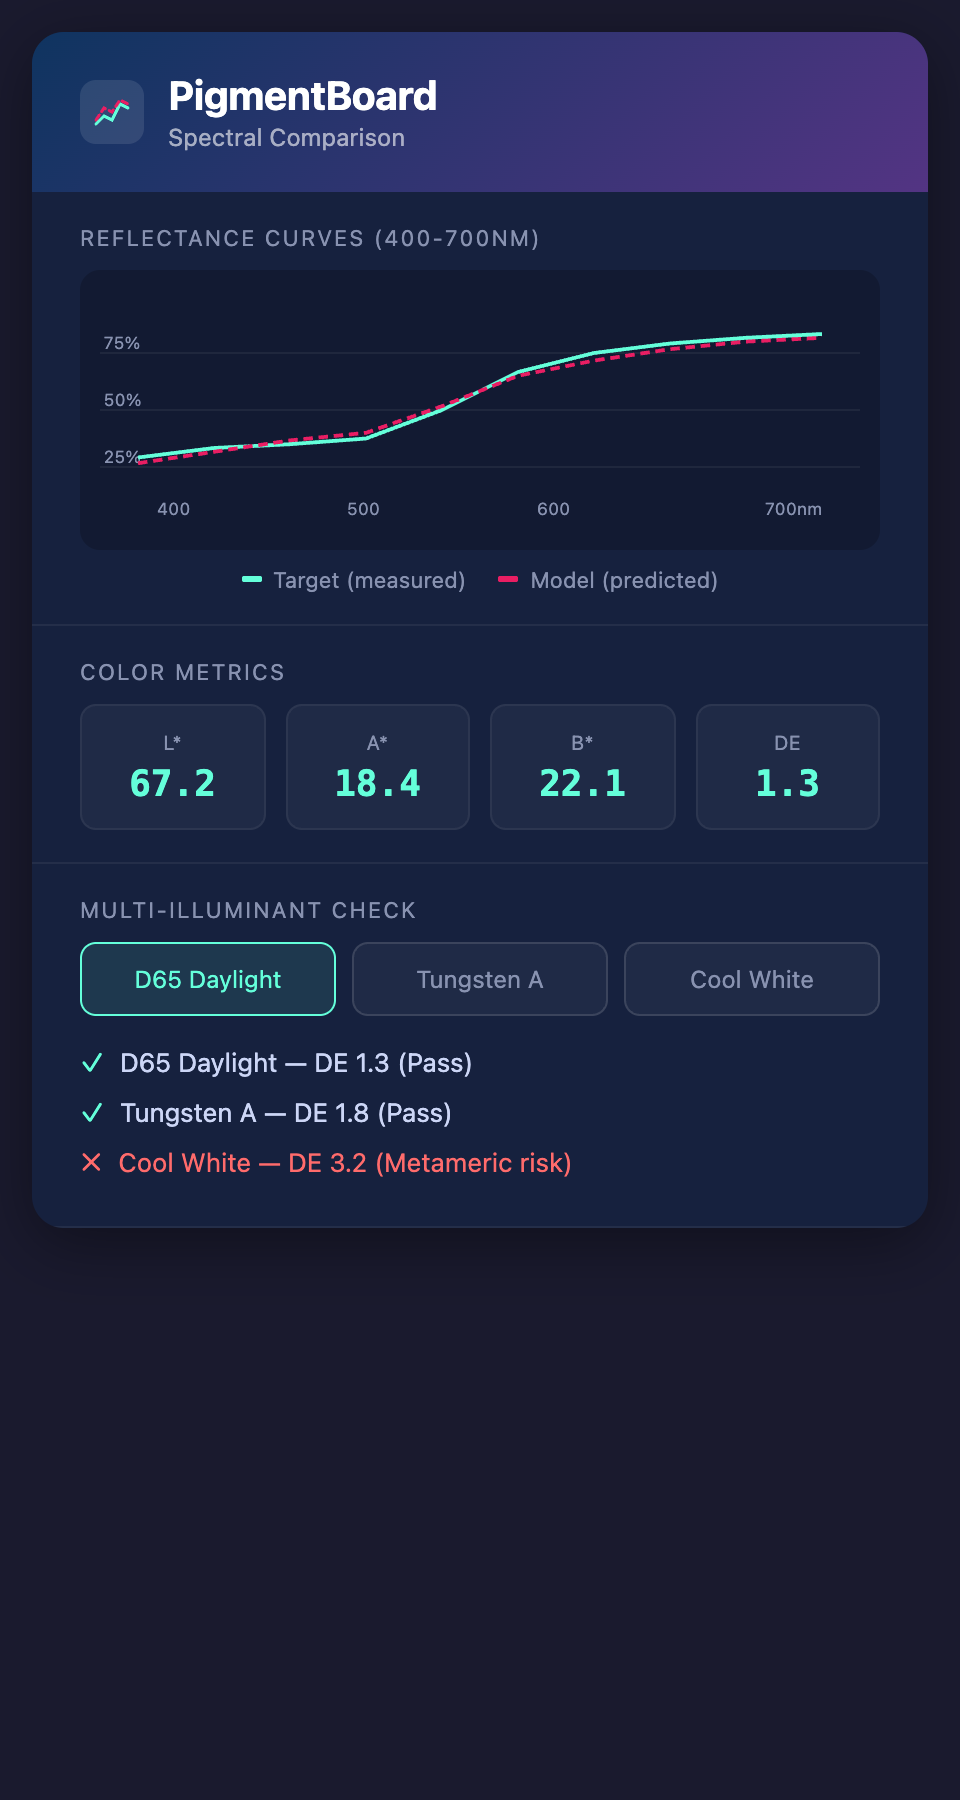
A spectrophotometer measures the spectral reflectance of a surface — the percentage of light reflected at each wavelength across the visible spectrum (roughly 400-700nm). This produces a spectral curve that is a unique "fingerprint" of the color.
From this spectral data, the instrument calculates colorimetric values, most commonly:
- Lab* — A three-dimensional color space where L* is lightness, a* is the red-green axis, and b* is the yellow-blue axis
- Delta E (ΔE) — The numerical difference between two colors. A ΔE of less than 1.0 is generally considered imperceptible to the human eye. A ΔE of 2-3 is noticeable but acceptable in many applications.
Strengths of Spectrophotometry
Objectivity. The number does not change based on who is holding the instrument, what time of day it is, or whether the operator had coffee.
Repeatability. Measure the same spot tomorrow, next week, next year — you get the same numbers (assuming the surface has not changed).
Communication. Lab* values can be shared across institutions, countries, and languages. "5R 7/4" means the same thing in Tokyo and London.
Trend detection. By measuring a textile periodically, you can detect color changes too subtle for the eye to notice — early warning of accelerated degradation.
Metamerism detection. Comparing full spectral curves (not just Lab* values) reveals whether two colors that look the same under one light source will diverge under another.
Limitations of Spectrophotometry
Small measurement area. Most portable spectrophotometers measure a circular area of 3-8mm diameter. Historic textiles are often heterogeneous — a single 5mm spot may not represent the overall color of an area.
Surface texture sensitivity. The same pigment on a smooth surface and a textured weave will give different readings, even though they look the same to the eye.
Cannot assess visual integration. A repair that measures ΔE = 0 against the target might still look wrong if it has a different surface texture, sheen, or transparency than the surrounding area.
Does not account for viewing distance. Museum visitors view textiles from 1-3 feet away. At that distance, small color variations average out. A spectrophotometer measures from 1 cm away.
Cost and access. Research-grade spectrophotometers cost $5,000-$20,000+. Many smaller conservation labs do not have one.
Strengths of Visual Assessment
Holistic judgment. A trained conservator does not just see color — they see texture, sheen, transparency, brushwork, and how a repair integrates with its surroundings. No instrument captures all of these simultaneously.
Context awareness. The eye automatically evaluates a repair in the context of the surrounding textile. A color that is technically "wrong" may look right because it harmonizes with adjacent colors.
Gallery-relevant. Ultimately, the repair needs to be invisible to a museum visitor standing at normal viewing distance. The conservator's eye is the best proxy for that visitor's experience.
Speed. A quick visual check takes seconds. Setting up a spectrophotometer, taking readings, recording data — that takes minutes per measurement point.
Limitations of Visual Assessment
Subjectivity. Two conservators can disagree about whether a match is acceptable. Neither is wrong — their perceptions differ.
Fatigue effects. Color discrimination accuracy decreases with fatigue. A match approved at 4:30 PM on Friday may look off on Monday morning.
Adaptation. After staring at a color for minutes, your perception of it changes. Conservators learn to look away periodically to "reset" their eyes, but adaptation still affects judgment.
Non-transferable. You cannot share what you see with a colleague in another city. You can share a number.
The Combined Workflow
The most effective approach uses both tools at different stages:
Stage 1: Objective baseline (spectrophotometry)
- Measure the target area (multiple points to account for heterogeneity)
- Record Lab* values and full spectral curves
- Establish a numerical target and acceptable tolerance (e.g., ΔE < 2.0)
Stage 2: Model-informed mixing
- Use the spectral data and known degradation factors to predict a formula
- Mix the formula and measure it with the spectrophotometer
- Adjust until the measured values are within tolerance
Stage 3: Visual evaluation
- Apply the matched color to a test area or reversible substrate
- Evaluate visually under gallery-equivalent lighting conditions
- Assess overall integration — color, texture, transparency, sheen
- Make final adjustments based on visual judgment
Stage 4: Final verification (both)
- Measure the final result with the spectrophotometer to confirm ΔE is within tolerance
- Visually confirm the repair is invisible at normal viewing distance
- Document both the numerical values and the visual assessment
When to Prioritize Which
Prioritize spectrophotometry when:
- Working across a large collection where consistency matters more than any single match
- Documenting baseline conditions for long-term monitoring
- Communicating color targets to colleagues at other institutions
- Detecting metamerism risks
Prioritize visual assessment when:
- Making final pass/fail decisions on individual repairs
- Working on highly textured surfaces where point measurements are unreliable
- Matching areas where color varies naturally (e.g., hand-dyed textiles with inherent unevenness)
- Evaluating repairs under actual gallery lighting conditions
The Role of Digital Degradation Modeling
Degradation modeling tools add a third dimension to this workflow. By modeling the aging process digitally, you can:
- Generate a predicted spectral curve for the degraded pigment (not just a visual approximation)
- Compare the predicted curve to the measured curve from the spectrophotometer
- Adjust degradation parameters until the model matches the measurement
- Use the calibrated model to generate a pigment formula
This creates a tight loop between objective measurement, scientific modeling, and visual assessment — each informing and validating the others.
Making Your Choice
You do not have to choose between instruments and eyes. The question is not "which is better?" but "which is appropriate for this decision at this stage of the process?"
Use instruments for measurement. Use models for prediction. Use your eyes for judgment. Together, they produce results that none can achieve alone.
Want to add scientific degradation modeling to your spectrophotometry and visual workflow? Join the PigmentBoard waitlist.