Statistical Methods for Evaluating Degradation Consistency
From Opinion to Statistics
Traditional authentication concludes with an expert's opinion: "consistent with the claimed date" or "inconsistent." While expert opinion is valuable, it is strengthened considerably when supported by statistical analysis.
The Basic Statistical Question
Given a textile claimed to be from a specific era and context:
- What is the expected range of degradation for genuine textiles of this type?
- Does the suspect textile fall within that range?
Building the Expected Range
From your database of verified genuine textiles, calculate:
For each dye type and age category:
- Mean degradation level (measured as ΔE from estimated original, or as specific spectral parameters)
- Standard deviation
- Range (minimum and maximum observed)
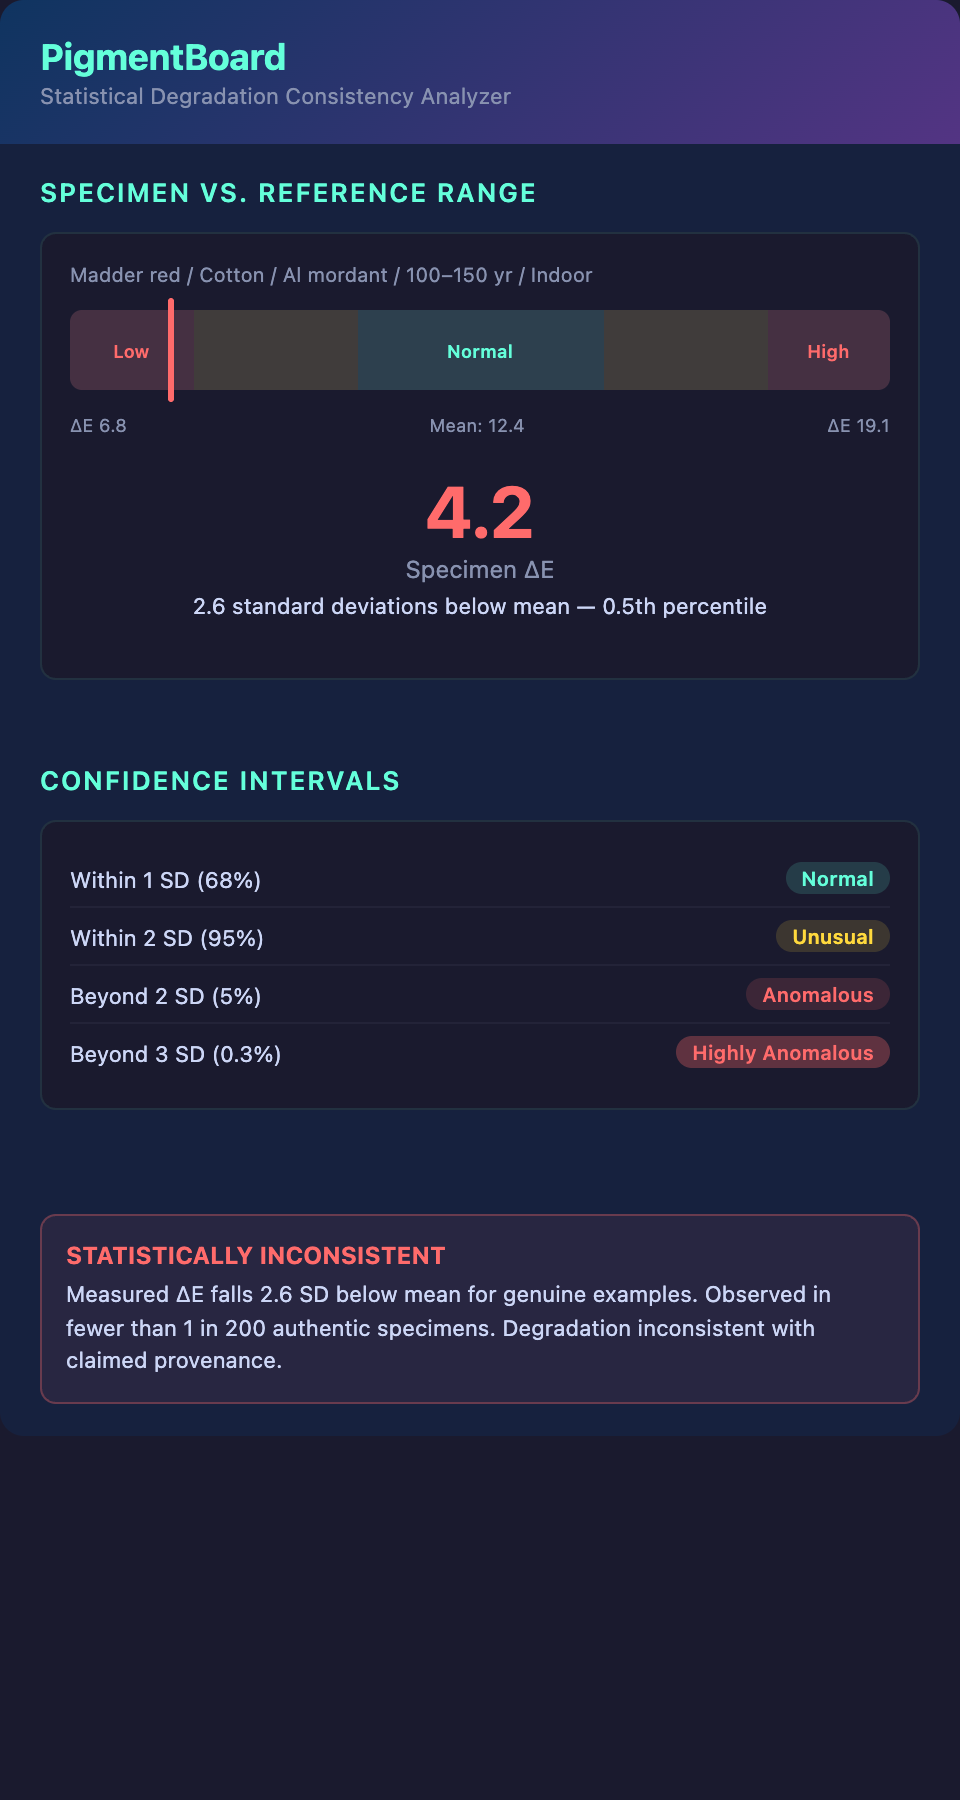
Example: For madder red on cotton, aluminum mordant, age 100-150 years, indoor display:
- Mean ΔE from estimated original: 12.4
- Standard deviation: 3.2
- Range: 6.8 - 19.1
A suspect textile claimed to be in this category with ΔE = 4.2 is well below the expected range (more than 2 standard deviations below the mean). This is statistically suspicious.
Confidence Intervals
Using the standard deviation of your reference data, establish confidence intervals:
- Within 1 SD of the mean (68% of genuine examples): Normal variation
- Within 2 SD (95%): Likely genuine, with some unusual but possible variation
- Beyond 2 SD (5%): Unusual — requires explanation
- Beyond 3 SD (0.3%): Highly unusual — strong indication of anomaly
Multivariate Analysis
A single measurement (e.g., overall ΔE) is less informative than multiple measurements:
- ΔE for red areas AND blue areas AND ground fabric
- Spectral comparison at multiple wavelengths
- Degradation pattern at multiple locations on the textile
Multivariate analysis tests whether all measurements fall within the expected multivariate range. A textile might have plausible individual measurements but an implausible combination.
Sample Size Limitations
Statistical analysis is only meaningful with adequate reference data. With fewer than 10 reference examples in a category, confidence intervals are wide and conclusions are tentative. This is why building the database (Blog Post 8) is so critical.
Presenting Statistical Results
In authentication reports, present statistical findings clearly:
- "The measured degradation falls 2.4 standard deviations below the mean for genuine textiles of this type and age, placing it at the 0.8th percentile."
- "This degree of deviation is observed in fewer than 1 in 100 genuine examples, suggesting the degradation is inconsistent with the claimed provenance."
This is more defensible than "it does not look right" and more persuasive in legal and scholarly contexts.
Want to generate statistically testable degradation predictions? Join the PigmentBoard waitlist.