Real-Time Monitoring of Demolition Progress Metrics
Why Traditional Status Reporting Fails Demolition Projects
Most project managers gather status information weekly or bi-weekly: site visits, crew reports, and contractor updates bundled into a status report distributed days after the actual work. By the time leadership receives information that last week's phase was 30% slower than planned, it's already too late to implement corrections for this week.
Real-time monitoring transforms this lag from a management liability into an asset. When you know within hours that a demolition sequence is proceeding slower than baseline, you can adjust resources, modify sequencing, or implement alternative approaches while the problem is still small. By the time the weekly status report is compiled, you've already course-corrected.
The challenge isn't understanding why real-time monitoring matters—it's implementing it without creating a data-collection burden that slows down actual work.
Defining Metrics That Reveal True Progress
Not all metrics are equally valuable. Some metrics are easy to measure but don't actually reveal whether the project is on track. Others are critical to success but require discipline to collect.
Focus your real-time monitoring on metrics that actually predict project success:
Volume removed per day: This is your primary demolition productivity metric. Each phase of demolition targets removing a specific volume of material. If you're removing 500 cubic yards per day and your baseline plan assumed 400 cubic yards per day, the phase will finish early. If you're removing 300 cubic yards per day, you're behind and need to identify why.
This metric is straightforward to measure: truck counts or scale weights provide actual volume data. Compare daily volume to planned volume and you immediately know if the current phase is on pace.
Material segregation compliance: If your demolition contract or environmental requirements mandate material segregation (concrete, metals, wood, hazardous materials handled separately), track segregation compliance daily. Projects that fall behind on segregation early typically have compounding problems later—mixed material piles, disposal delays, regulatory issues.
Count loads by material type daily and compare to the baseline material mix expected from that phase.
Safety incidents and near-misses: Track incidents and near-misses daily, not weekly. A project that's experiencing one safety incident per week is showing a trend that will lead to serious injury. Early visibility lets you implement corrective measures.
Establish a simple reporting requirement: each crew reports incidents and near-misses daily. A simple form takes 60 seconds to complete. Aggregate daily and flag trends immediately.
Equipment utilization: If a $3,000/day excavator is on-site running 4 hours per day instead of 8 hours, you're burning money. Track equipment runtime daily. If utilization is consistently below 80%, investigate why and resolve it.
GPS-tracked equipment and telematics systems provide this automatically. If you're not using equipment tracking, assign a crew member to log equipment status on an hourly basis.
Utility isolation completion: When you're transitioning between phases that require utility modifications, track which utilities have been isolated and which remain. A phase can't fully transition until all utilities are isolated and temporary systems are active. Track this daily.
Dust and environmental monitoring: If you're monitoring dust, vibration, or air quality due to environmental requirements or adjacency impacts, collect data continuously. Real-time alerts let you modify operations immediately if thresholds are exceeded. Don't wait for weekly reports to learn that ambient dust exceeded limits on Tuesday.
Crew productivity by location: Beyond overall volume, track crew productivity by location. If the north building section is progressing 20% slower than the south section, investigate whether it's a different structural type, different hazardous materials, or different crew effectiveness. Early identification lets you address the disparity.
Implementation Approaches That Don't Burden Crews
The biggest barrier to real-time monitoring is that gathering detailed data takes time, and every minute spent collecting data is a minute not spent doing work. Effective real-time monitoring systems minimize data collection overhead.
Automated data sources: Use existing systems that already generate data. Scale weight tickets show material volume. GPS equipment telemetry shows equipment location and runtime. Photo timestamping during daily site walks provides visual progress documentation. Utility meters show electrical consumption or water usage changes indicating utility isolation.
By relying on data that's already generated, you avoid creating new reporting requirements.
Simplified crew reporting: Ask for absolute minimum data from crews. Rather than a detailed time-motion study, ask: "How many truck loads today?" or "Did you complete utility isolation for the third floor?" or "What challenges slowed progress?" Simple questions take 30 seconds to answer and provide enough signal to detect trends.
Establish a standard time each day—ideally end of shift—when the site supervisor provides brief metrics to the project manager. Consistency matters more than comprehensiveness.
Visual documentation: Daily site photographs with timestamps provide objective progress documentation and often reveal issues better than written descriptions. Assign someone to take 20-30 photos daily from consistent locations. Review photos weekly to see visual progress and spot any emerging issues.
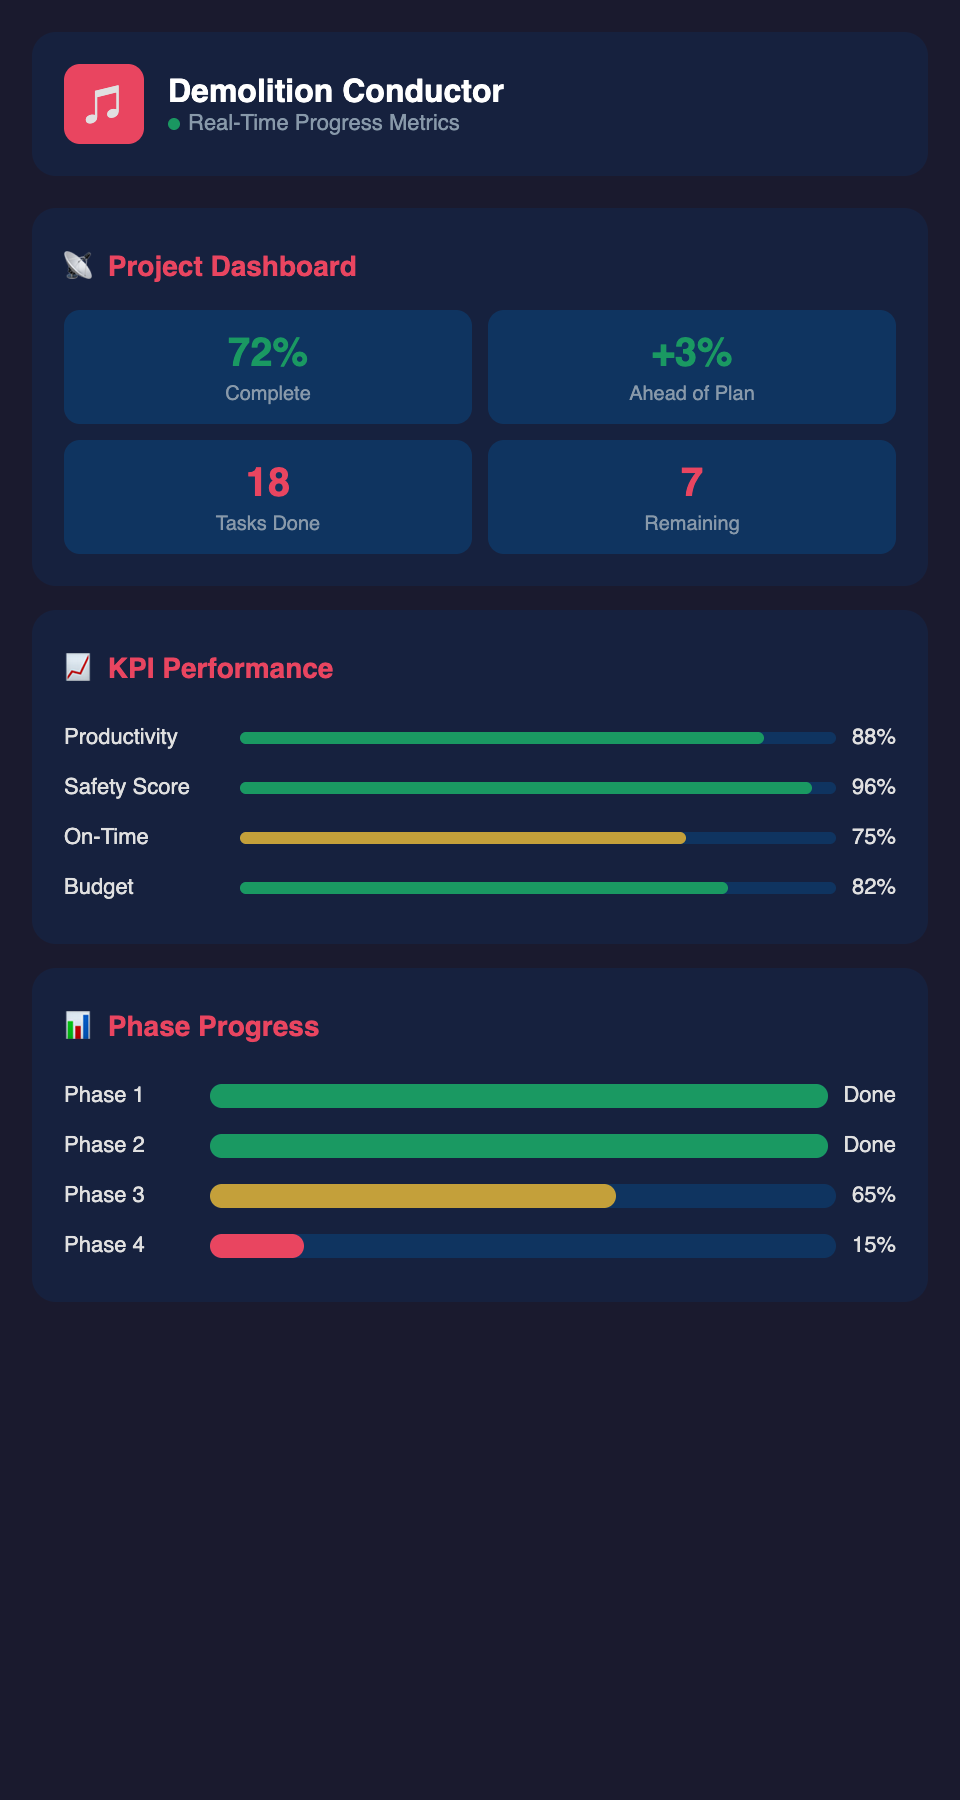
Dashboard aggregation: Collect all metrics in a simple shared dashboard that everyone can access. This replaces lengthy status emails—the dashboard becomes the source of truth. It should answer three questions instantly: Are we on schedule? Why or why not? What's the recovery plan?
Real-Time Decision Protocols
Real-time monitoring is only valuable if it triggers real-time decisions. If you collect data daily but make decisions weekly, you've created extra work without added value.
Establish decision protocols:
Daily standup: The project manager, site supervisor, and key trade leads spend 15 minutes each morning reviewing the previous day's metrics and any emerging issues. This creates visibility and prevents surprises. If yesterday revealed that a phase is 15% behind, everyone knows before starting today that you need to adjust approach.
Threshold-triggered escalation: Define specific conditions that trigger immediate escalation:
-
If productivity drops below 70% of baseline for two consecutive days, investigate immediately
-
If environmental monitoring exceeds limits, stop work and implement controls
-
If safety incidents exceed one per week, implement additional safety measures
-
If equipment utilization falls below 60%, determine whether to release equipment or reallocate crew
When thresholds are exceeded, decisions are made immediately, not deferred to the next project meeting.
Recovery planning: When metrics reveal that a phase is behind, develop a recovery plan within 24 hours. Recovery might mean: adding crew, extending hours, modifying the sequence, or adjusting downstream schedules. But you make a conscious decision, not hope to catch up.
Document the recovery plan and review daily whether it's working. If recovery isn't happening, adjust the plan again rather than accepting the delay as inevitable.
Communicating Metrics to Stakeholders
Real-time monitoring data is valuable for internal management but must be translated carefully for external stakeholders. Providing raw daily metrics creates noise and confusion. Provide stakeholders with weekly summaries that focus on:
-
Trend analysis: Is the project accelerating, on track, or behind? Show this visually.
-
Forecast impact: If current trends continue, will the project finish on time?
-
Corrective actions: If behind, what are you doing about it?
-
Upcoming risks: What's the next critical phase and what could derail it?
Stakeholders don't need daily details. They need to know status and confidence in the timeline. Real-time monitoring lets you answer those questions with confidence rather than estimates.
Learning From Historical Data
After the project completes, the real-time monitoring data becomes your historical baseline. What volume per day did you actually achieve? How did productivity vary by zone? Which equipment performed best? How accurate were your original estimates?
Create a lessons-learned database of this information. The next similar project uses your actual historical data to estimate durations, not generic industry benchmarks. Over multiple projects, this historical data becomes your competitive advantage—you estimate more accurately and schedule more realistically than competitors relying on generic guidelines.
Real-time monitoring transforms demolition from a reactive process where you discover problems in hindsight to a proactive process where you manage problems in real-time. This shift creates predictability, reduces delays, and enables better-informed decision-making.
Ready to implement real-time monitoring on your next demolition project? Join our waitlist to access platforms that automate data collection and provide actionable insights.