Visualizing Complex Demolition Dependencies Clearly
Why Visualization Matters for Demolition Planning
A 400-task demolition project has hundreds of dependencies. Task 47 (install temporary support) enables Task 52 (remove central column), which enables Tasks 89-104 (interior demolition). Task 187 (hazmat clearance) blocks multiple parallel streams of work. Without visualization, these relationships exist only in document spreadsheets and project manager heads.
When relationships are invisible, mistakes happen. A crew begins work on a task before its prerequisites are complete. A supervisor doesn't realize their project is blocking three other projects. A delay in one task cascades unexpectedly through the schedule because the relationship was unknown.
Visual dependency mapping solves this by making relationships explicit and understandable at a glance.
The Foundation: Understanding Dependency Types
Different demolition tasks create different dependency relationships. Understanding these types is essential for accurate mapping.
Sequential Dependencies (Finish-to-Start)
Task B cannot begin until Task A is completely finished.
Examples in demolition:
-
Temporary support installation must finish before structural column removal begins
-
Hazmat abatement must finish before general demolition crews enter the contaminated area
-
Interior demolition must finish before structural deconstruction begins
These are the most common and most restrictive dependencies. They're also the easiest to understand and communicate.
Partially Overlapping Dependencies
Task B can begin before Task A finishes, but not until Task A is X% complete.
Example:
-
Interior demolition can begin on the second floor while the third floor is still being deconstruction'd (interior work needs 70% of structural area cleared first)
-
Material removal can begin while deconstruction is ongoing (as long as 50% of structural material is removed)
These dependencies allow schedule compression and are critical for accelerating large projects.
Resource Dependencies
Two tasks compete for the same limited resource (crew, equipment) and cannot run simultaneously.
Example:
-
Project A needs the hazmat team March 20-26
-
Project B needs the hazmat team March 24-30
-
These tasks have a 3-day conflict—one project must shift its schedule
Resource dependencies are often missed in initial planning, then create crises mid-project.
Constraint Dependencies
External factors create timing requirements (permits, inspections, regulatory approvals).
Example:
-
Hazmat removal cannot begin until environmental permit is issued
-
Foundation removal cannot begin until structural demolition is inspected and approved
-
Reuse deconstruction cannot begin until salvage permits are processed
These dependencies are often assumed to be resolved and then become surprises when they're delayed.
Creating a Visual Dependency Network
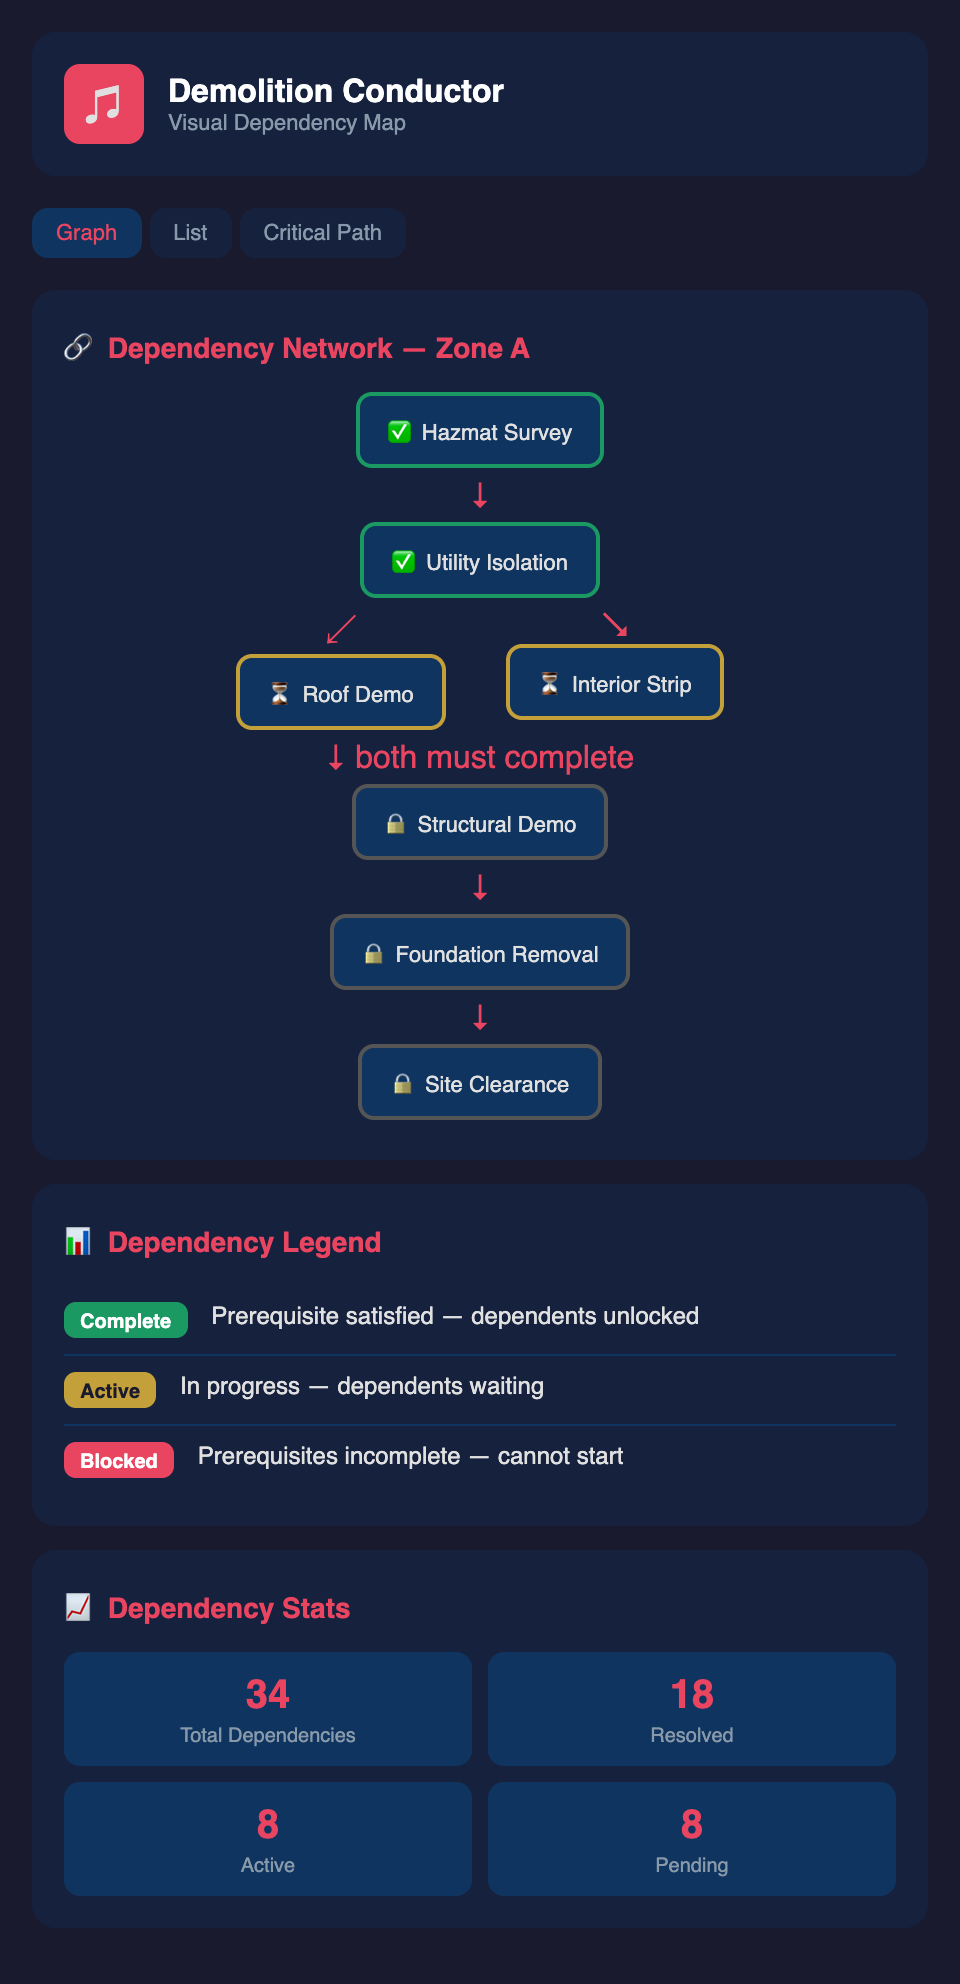
The most effective visualization for complex projects is a network diagram (also called a PERT chart or precedence diagram).
The Basic Network Structure
Each task is a node. Dependencies are arrows pointing from prerequisite to dependent task.
[Hazmat Survey]
↓
[Hazmat Abatement]
↓
[Install Temporary Support]
↙ ↘
[Interior [Structural
Demolition] Deconstruction]
↓ ↓
[Material [Steel Salvage]
Removal] ↓
↘          ↙

[Foundation Removal]

     ↓

[Site Closure]
This simple visualization shows:
-
Hazmat work is sequential (blocks everything downstream)
-
Interior demolition and structural deconstruction can happen in parallel after temporary support is ready
-
Foundation removal is the final phase
Any project manager can quickly understand the critical path (Hazmat → Temporary Support → Structural → Foundation) and see that interior demolition is independent work.
Adding Task Details to the Network
For larger projects, enhance each node with:
-
Task name and ID
-
Duration (days or weeks)
-
Responsibility (crew type or specific person)
-
Status (planned, in-progress, complete)
-
Critical path indicator (red = on critical path, yellow = has some float)
Updated diagram:
[Hazmat Survey - 10d]
↓
[Hazmat Abatement - 14d] RED (Critical Path)
↓
[Temp Support - 5d] RED
↙ ↘
[Interior [Struct Removal
Demo - 21d] - 28d] RED
↓ ↓
[Material [Steel Salvage
Removal - 10d] YELLOW
-
14d]
↘ ↙
[Foundation - 7d] RED
↓
[Closure - 2d]
Now stakeholders can see:
-
The critical path (red tasks) is where to focus management attention
-
Hazmat is a major bottleneck (10+14 days before real structural work starts)
-
Interior demolition has 7 days of float (can slip without impacting end date)
Visualizations for Different Audiences
Different stakeholders need different visualizations.
For Crew Supervisors: Task-Level Dependency Charts
Show only the next 2-3 weeks of work with clear prerequisites:
"Your interior demolition team begins Monday if and only if:"
-
✓ Temporary support is installed and load-tested
-
✓ Structural bracing is confirmed secure
-
✓ Hazmat clearance has been certified
Use a simple checklist format. Supervisors need concrete prerequisites, not abstract network diagrams.
For Project Managers: Gantt with Dependency Lines
A Gantt chart shows timeline and duration:
-
Each task is a horizontal bar
-
Bar length represents duration
-
Dependency arrows connect tasks
-
Critical path is highlighted in red
This format answers: "When does each task happen relative to others? Which tasks are on the critical path?"
For Executive Leadership: Milestone-Level Summary
Show only major phases:
-
Phase 1: Environmental Assessment (Weeks 1-2)
-
Phase 2: Hazmat Remediation (Weeks 3-5)
-
Phase 3: Structural Demolition (Weeks 6-12)
-
Phase 4: Foundation Removal & Closure (Weeks 13-14)
Include critical milestones:
-
⚠️ Environmental permit required by Week 1
-
⚠️ Structural inspection required before Phase 4
-
⚠️ Equipment mobilization must occur Week 4
Executives care about phases, timelines, and risks—not individual task dependencies.
Case Study: Visualizing a 12-Building Complex
A demolition firm was managing the sequential deconstruction of a 12-building industrial complex. Originally, the project manager maintained dependencies in his head and spreadsheet notes. When scheduling conflicts emerged, communication broke down:
-
General demolition crew began interior work before temporary support was confirmed installed
-
Two different project managers scheduled the same equipment for overlapping weeks
-
Material removal was scheduled before structural demolition completed on adjacent buildings
By creating a visual network diagram:
-
All dependencies became explicit (5 critical path items, 18 items with float, 12 resource conflicts)
-
The firm discovered they'd over-scheduled the hazmat team by 3 weeks initially
-
Crew supervisors could see their prerequisites clearly
-
Executive leadership could see the critical path was 18 weeks, not the 16 weeks originally estimated
This visualization prevented confusion, enabled accurate scheduling, and aligned the entire 40-person team on the logic of the project.
Tools for Visualization
You don't need expensive software. Effective options include:
-
Microsoft Project / Monday.com — Professional PM tools with dependency visualization
-
Simple Gantt tools (Smartsheet, Asana, even Google Sheets) — Quick dependency communication
-
Whiteboard + photos — Fast visualization for small projects, easy to iterate
-
Custom spreadsheets — Works fine if you maintain discipline about updating
The key isn't the tool—it's that dependencies are visualized explicitly and updated when the plan changes.
Maintaining Accuracy as Projects Evolve
The biggest failure mode: create a detailed dependency map, then let it become outdated. By mid-project, the visualization no longer matches reality, and crews stop trusting it.
Discipline required:
-
Update dependencies weekly when actual progress diverges from plan
-
Flag dependencies that changed due to delays or replanning
-
Communicate changes to all stakeholders immediately
-
Use version control (date-stamped versions, so people know if they're looking at current plan)
A slightly-outdated visualization is worse than no visualization—it creates false confidence and causes confusion when reality doesn't match the map.
Ready to visualize your entire demolition portfolio with crystal-clear dependencies so every crew member understands their prerequisites and critical path? Join the waitlist today.