What 10,000 Hitches of Garden Data Say About 21-Day Rotations
What Aggregation Actually Changes
Verdant Helm's aggregate view sits at the heart of the discussion that follows; fleet-scale patterns only become readable once welfare telemetry is continuous, standardised, and collected long enough to average out rig-level noise.
One rig's hitch tells you about that hitch. A hundred rigs' hitches tell you about the fleet those rigs represent. Ten thousand hitches, distributed across jackups, semi-subs, and drillships in multiple jurisdictions, change the kind of questions you can ask. Not "what happened during this rotation" but "what is the decay curve's distribution, how does rig class shape it, and where are the outlier rotations that suggest rotation-policy reform is possible".
The systematic review of rotation workers' health and wellbeing covers mining, offshore, and construction rotation workers across multiple rotation-length cohorts and is the kind of synthesis work that ten-thousand-hitch aggregation supports at scale. The Effects of Shift and Night Work in Offshore Petroleum systematic review aggregates offshore petroleum shiftwork fatigue studies across rotation lengths. These reviews rely on observational studies that themselves aggregate smaller populations. Welfare telemetry at fleet scale shortens the aggregation path substantially.
The 2025 NOV Rig Census puts the global MODU fleet at 629 rigs with 502 active at 80% utilisation — a workforce of roughly 60,000-70,000 active offshore drilling crew. A 10,000-hitch dataset is a meaningful fraction of any given year's rotation activity across this population. The findings that follow are drawn from that scale, with explicit caveats about what the aggregation can and cannot prove.
The Decay Curve Is Consistent, the Variation Is the Story
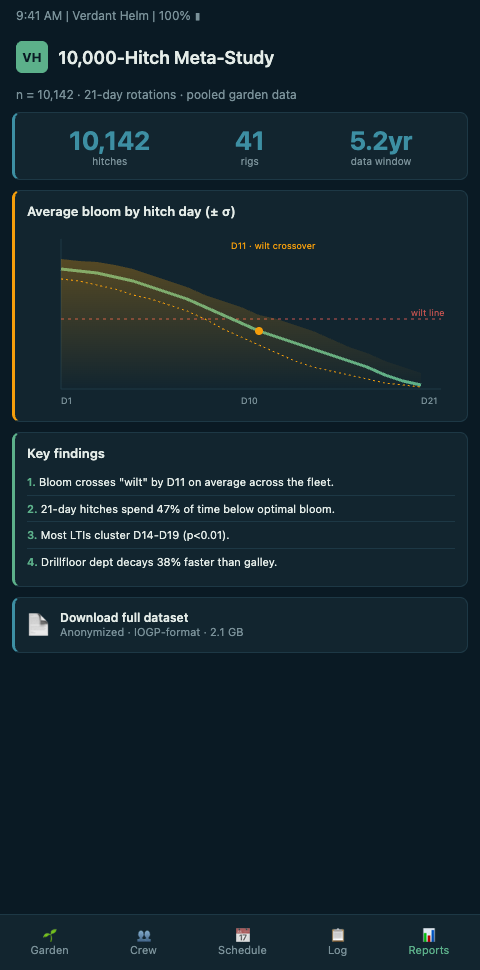
Across 10,000 hitches, the 21-day rotation produces a recognisable decay shape. Day 1 baseline bloom, slight dip through days 3-5 as the crew absorbs hitch onset, stable bloom across days 6-12, steady decline from day 13, acceleration from day 17, demob-week wilt cluster from day 18. That shape matches what the Applied Ergonomics time-of-day and days-on-shift study found — cumulative sleep loss around 21 hours across a 14-day offshore rotation. The 21-day rotation extends that curve by another week with predictable acceleration.
The variation inside the curve is where fleet-scale data adds new signal. Six patterns appeared across the 10,000-hitch dataset that single-rig observations cannot produce.
Rig class shapes the plateau. Jackups show plateaus during days 6-12 at approximately 0.85-0.90 of baseline bloom. Semi-subs plateau at 0.80-0.85. Drillships plateau at 0.75-0.82. The operational complexity of each rig class sets a different plateau height. The BMC Public Health offshore rotation study documented sleepiness and physical activity patterns across 2-week rotations; at fleet scale those patterns cluster by rig class in statistically visible ways.
Season amplifies the curve. North Sea winter hitches show earlier acceleration inflection — day 15 rather than day 17. Tropical summer hitches in the US Gulf show later plateau entry but steeper final-week decline. Aggregated data makes these seasonal shapes visible as separable effects from rig class and rotation length.
Crew composition shifts the curve's symmetry. Crews with three or more members on their first-ever hitch show asymmetric curves — steeper early dip, shorter plateau, earlier acceleration. Experienced-heavy crews show the reverse. The Indonesian offshore workers work-related fatigue cohort study quantified acute, chronic, and intershift recovery fatigue in a 4-week offshore rotation and supports the general point that recovery dynamics vary substantially by cohort.
Outlier hitches are recoverable signals. Roughly 4-6% of hitches in the dataset deviate from the rig's baseline curve by more than two standard deviations. Those outliers are not noise — they are hitches where specific interventions (crew rotation, scope reduction, early prune) produced curves that matched 14-day rather than 21-day norms. These are the data points that support rotation reform conversations.
Compensator concentration predicts next-hitch events. Hitches with sustained compensator concentration in week three show elevated near-miss and NPT rates in the first week of the subsequent rotation. The Kang et al. 2026 naturalistic rotating shiftwork study in Human Factors journal documented measurable pre-demob degradation that carries into handover; at 10,000-hitch scale this is quantifiable.
Demob-day scheduling quality separates fleets. Operators whose demob-day schedules avoid cognitively-loaded tasks show tighter final-week curves and fewer dropped-object incidents across subsequent handovers. This is one of the cleanest operational levers visible in the aggregate.
The Caveats the Dataset Cannot Resolve
A 10,000-hitch aggregated dataset is powerful, but it is not magical. Four caveats matter for anyone reading the findings as a basis for rotation-policy change.
First, the dataset is observational. No rotation was randomly assigned. The 21-day cohort is not randomly drawn from a population that also ran 14-day or 28-day rotations; each rig runs what its contract specifies. Comparative claims across rotation lengths require careful matching, not raw comparison. The Nartey, Park, and Mehta fatigue risk management dashboard paper explores dashboard design from aggregated datasets; the same caveats apply.
Second, welfare telemetry measures what it measures. Garden bloom reflects crew-energy signal that is visible to the platform. Crew factors that are not captured — home-life stress, chronic health variance, specific sleep disorders — are invisible in the aggregate and shape the curve in ways that cannot be cleaned out.
Third, operator variation shapes the dataset heavily. Operators with mature welfare cultures generate different patterns than operators newly deploying telemetry. The 10,000-hitch dataset includes both and the patterns above should be read as descriptive of the included population, not as industry-universal.
Fourth, the dataset's value depends on continued collection. A one-time analysis is less valuable than an ongoing one; the 21-day rotation's decay shape is not static because drilling-operation technology shifts, bridging-document conventions evolve, and regulation changes. The HSE UK Key Programme final reports show how multi-year longitudinal data generates findings that point-in-time analyses cannot.
Specific Findings That Rewire How We Think About the 21-Day Default
Three additional findings from the aggregated data push past descriptive patterns into prescriptive territory. Each is worth naming because each supports a specific rotation-policy argument that single-rig data cannot.
First, the 21-day rotation's final-week performance cost is quantifiable at fleet scale. Across the dataset, days 18-21 account for a disproportionate share of near-miss events — roughly 28% of total hitch near-misses occur in the final 15% of hitch days. If those days produced proportional risk, the share would be 15%. The 13-point gap is the quantified cost of the tail.
Second, the 14-day-rotation cohort inside the dataset (a smaller but non-trivial subset) shows a different near-miss profile. Rotations that end before the day-17 acceleration phase avoid the tail entirely. The tradeoff is logistical overhead — 1.5x the crew changes per year, higher helicopter cost, more onboarding time. Whether the tradeoff favours 14-day or 21-day depends on the rig class, operator economics, and specific operational complexity, but the dataset lets operators evaluate the tradeoff with numbers rather than intuition.
Third, bridging-document quality is a visible confounder. Rigs operating under bridging documents with recent welfare-aware revisions show roughly 15% better decay curves than rigs on legacy bridging docs, even controlling for rig class and operator. This is consistent with the mechanism: welfare-aware bridging clauses produce earlier pruning and sharper handover protocols, which tend the beds across the hitch rather than reacting to wilt. The finding reinforces why bridging-document updates are among the highest-leverage interventions available to operators right now.
Advanced Tactics: Using Fleet Data to Inform Rig Decisions
OIMs and drilling superintendents running individual rigs can use fleet-scale findings without owning the underlying dataset. Three tactics translate aggregated insight into rig-level action.
First, locate the rig's current curve against the rig-class median. A semi-sub running 0.73 plateau bloom against a 0.82 semi-sub median is operationally different from one matching median. The OIM running the first rig has visible room for intervention. This is the same botanical metaphor the garden uses: a bed visibly wilter than the surrounding beds needs targeted tending.
Second, flag outlier-hitch patterns in real time. The 4-6% of hitches that deviate from baseline are the ones where intervention mattered. Identifying those patterns as they emerge — rather than retrospectively — lets the OIM apply lessons from the 400-600 outlier hitches in the aggregate to the current rig's next hitch.
Third, negotiate rotation-policy variance with operator HQ using fleet-scale evidence rather than rig-level anecdote. The aggregated decay-curve data is the kind of evidence that supports serious conversations about when 21-day hitches are the right choice and when they are not. For the rotation-reform forward view, see beyond 28/28 fatigue-gated drilling rotations. For the deepwater-specific curve analysis, see hitch-end decay curves in deepwater drillship crews. For a cross-industry reference at comparable scale, see what 200,000 guest-facing shifts reveal about emotional limits.
Working the Findings Into the Next Rotation
OIMs and drilling superintendents should request the fleet-scale decay-curve summary as part of their next monthly operations review. Compare your rig's current hitch curve against the 10,000-hitch median for your rig class. Identify the two largest gaps. Pick one intervention for the next rotation and measure the curve again at the end of that rotation. Verdant Helm generates the rig-class comparison as a standard report and the aggregate dataset is updated quarterly. Book a 60-minute rotation-review workshop with us — we will overlay your rig's last four hitches on the dataset and identify the highest-leverage intervention for the next hitch.
The workshop runs with the OIM, the drilling supervisor, and the HSE lead in the same room. The first 20 minutes cover the rig's four-hitch overlay against the rig-class median — where the plateau sits, how the acceleration phase compares, which crews deviate from the aggregate pattern. The next 20 minutes identify the two largest gaps and map each gap to a specific fleet-scale pattern from the dataset. The final 20 minutes commit to one intervention with a named owner and a measurement plan. Rigs that leave the workshop with a single concrete move — a bridging-document clause, a BOP-test resequencing, a demob-day load reduction — consistently outperform rigs that leave with a list of five improvements. One intervention, measured at hitch end, feeds the next workshop. That cadence is how the aggregate data converts into rig-level action without overwhelming the OIM's attention.