Crowd Tension Mapping for Multi-Stage Music Festivals
The Festival Security Problem Is Different
Stadium security is hard. Festival security is harder. The distinction matters because most crowd-management frameworks were developed for enclosed, structured venues — places with numbered seats, defined concourses, and controlled entry points. A multi-stage music festival throws away nearly every one of those structural advantages.
Consider the scale. Glastonbury Festival spreads across roughly 900 acres and hosts over 200,000 attendees across more than 100 stages (Glastonbury Festival Official Site). Coachella draws approximately 125,000 people per day to the Empire Polo Club grounds in Indio, California (Goldenvoice / Coachella). Bonnaroo covers 700 acres in rural Tennessee. These are not venues. They are temporary cities with populations that rival small municipalities — and the security infrastructure of a county fair.
The U.S. Bureau of Labor Statistics classifies event security as one of the fastest-growing occupational categories, yet the sector faces chronic understaffing, with the International Association of Venue Managers reporting that 72 percent of festival organizers cite security staffing as their top operational challenge (IAVM Venue Professional Magazine). Meanwhile, data from the UK's Health and Safety Executive indicates that mass-gathering events with capacities exceeding 10,000 experience a reportable incident rate of 2.5 per 1,000 attendees per day — a figure that climbs steeply at multi-day camping festivals where fatigue and substance use accumulate (UK HSE Event Safety Guide).
The fundamental challenge is that festival crowds are in constant motion. There is no halftime, no assigned section, no predictable flow. Fans drift between stages based on mood, word of mouth, and set times. The crowd at the main stage at 10 PM may bear no resemblance to the crowd at the same stage at 2 PM. Security teams that rely on static post assignments are perpetually out of position.
What Spatial Tension Mapping Looks Like at a Festival
Spatial tension mapping, as applied to stadiums, overlays behavioral indicators onto a venue map to produce real-time aggression and risk scores for every zone. The inputs are density clustering, movement anomalies, acoustic markers, and contextual overlays. The output is a live heatmap that tells security where trouble is forming before it becomes visible to the human eye.
At a festival, the same principles apply, but the implementation changes in three critical ways.
The map is not fixed. A stadium's spatial model is built once and updated seasonally. A festival's spatial model must be built from scratch for each event and may shift during the event itself. Stages, vendor rows, art installations, and campgrounds create a temporary geography that did not exist a week earlier and will not exist a week later. The tension-mapping system must ingest site plans, overlay them with real-time GPS and camera data, and produce a living map that accounts for terrain, elevation, and improvised pathways that attendees create by cutting through fields.
Crowd segments are fluid. In a stadium, Section 214 contains a relatively stable population for the duration of the event. At a festival, the crowd in front of the main stage at sunset is an entirely different group of people than the crowd that occupied the same space at noon. Tension mapping must track not just density in a zone but the rate and direction of population change. A zone filling rapidly from a single direction — say, a crowd surging toward a stage after a surprise guest is announced — carries a different risk profile than a zone filling gradually from multiple directions.
There are no walls. Stadium tension mapping benefits from architectural constraints that channel crowd flow into predictable corridors. Festival grounds are open terrain. Crowds can approach a stage from 270 degrees. Density pockets form and dissolve without the structural cues that camera systems are trained to recognize. This requires a shift from perimeter-based monitoring to field-based monitoring — a mesh of sensors, cameras, and human observers covering the interior of the crowd, not just its edges.
CrowdShield adapts to these conditions by treating the festival map as a dynamic graph rather than a static floor plan. Each node represents a micro-zone (roughly 10 meters by 10 meters), and the edges represent the flow capacity between adjacent zones. As real-time data feeds in — camera-based density estimates, wearable-sensor crowd-flow readings, acoustic levels from distributed microphones — the system recalculates tension scores across the entire graph every 30 seconds.
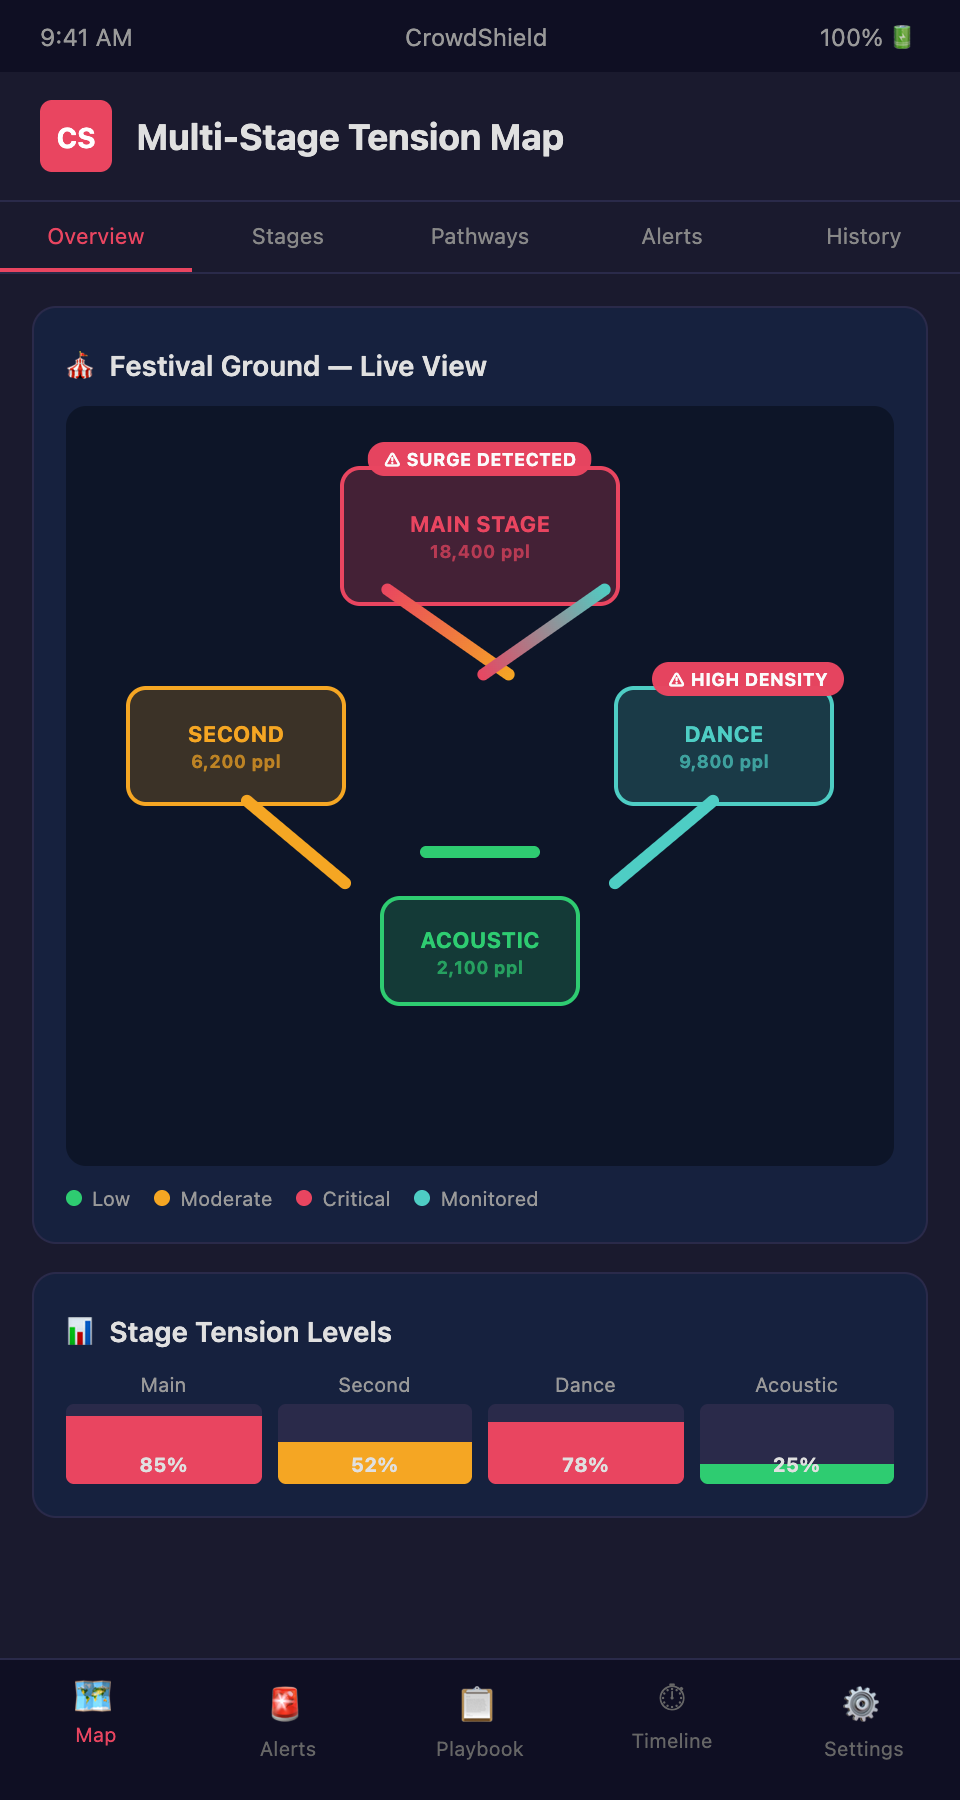
The output for a security supervisor looks like a weather radar overlay on the festival map. Green zones are within normal parameters. Yellow zones show a single elevated indicator — perhaps density climbing toward threshold or an unusual movement pattern. Orange zones have two or more converging risk factors. Red zones require immediate attention.
But a heatmap alone is not enough. The second half of the CrowdShield model is the choose-your-own-adventure prompt system. When a zone transitions from yellow to orange, the nearest security team member receives a context-specific decision prompt on their mobile device:
"North Field Stage — tension score 6.8. Rapid density increase from east pathway. Set transition in progress. Recommended actions: (A) Deploy crowd stewards to east pathway to widen flow channel. (B) Open auxiliary access route behind vendor row to redistribute density. (C) Request stage MC to make crowd-spacing announcement. (D) Escalate to operations center."
Each action feeds back into the model. If option A is selected and density growth slows, the score recalculates downward. If the score continues to climb, a second-tier prompt appears with more assertive options. This branching structure replaces the unstructured radio chaos that characterizes most festival security operations.
Advanced Tactics for Multi-Stage Environments
The most dangerous moments at a multi-stage festival are not during performances — they are between performances. When a headliner finishes on the main stage and 30,000 people begin moving simultaneously toward the second stage for the next act, the resulting crowd flow creates compression points at every pathway bottleneck. Tension mapping must anticipate these transitions by ingesting the published set-time schedule and pre-calculating flow projections for each transition window.
This predictive layer is where festival tension mapping diverges most sharply from stadium applications. At a stadium, the event is linear: arrival, game, departure. At a festival, there are dozens of micro-events nested within the macro-event, each generating its own crowd-flow signature. A sophisticated system models these overlapping flows and identifies where they intersect — the pathway junction where the main-stage exodus meets the second-stage queue, or the food-vendor corridor that serves as a shortcut between two stages and becomes impassable during transitions.
Historical data from previous editions of the same festival is invaluable here. Flow patterns at Bonnaroo 2024 will resemble flow patterns at Bonnaroo 2023 to a surprising degree because the stage layout, headliner scheduling logic, and attendee demographics are consistent year over year. A tension-mapping system that can ingest prior-year data and calibrate its flow models accordingly starts the event with a significant analytical advantage.
Festival operators should also consider how weather conditions interact with spatial tension. Rain compresses crowds into covered areas, creating sudden density spikes in locations that were designed for casual foot traffic, not standing-room occupancy. Extreme heat drives crowds toward shade structures and water stations, producing bottlenecks that the standard site plan never anticipated. A tension-mapping system that integrates live weather data and adjusts its zone-risk calculations accordingly provides a more accurate picture than one that treats the festival map as weather-independent.
For a detailed look at how tension mapping principles were originally developed for enclosed venues with fixed seating, see What Is Crowd Tension Mapping and Why Stadiums Need It Now.
For more on stage transition crowd flow and how to model the dangerous moments between sets, see Stage Transition Crowd Flow Management at Music Festivals.
For an exploration of how density measurement works differently in nightclub environments with extreme space constraints, see Understanding Crowd Density Thresholds and Aggression Risk in Venues.
Get CrowdShield for Your Festival
Multi-stage festivals are among the most complex crowd-management environments on earth. CrowdShield is purpose-built for this complexity — spatial tension mapping that adapts to open terrain, fluid crowds, and the unpredictable energy of live music. If you operate or secure a music festival and want to move from reactive incident response to proactive incident prevention, join the CrowdShield waitlist. Early partners will shape the platform with their own festival data and operational needs.