What Is Crowd Tension Mapping and Why Stadiums Need It Now
The Reactive Security Problem
Every major stadium operates some version of the same security model: hundreds of cameras, a command center with monitors, and radio-equipped staff scattered across sections. The fundamental flaw is timing. By the time an operator spots a fight on a monitor, punches have already landed, bystanders are involved, and the situation requires physical intervention rather than de-escalation.
The numbers confirm the gap. According to the National Center for Spectator Sports Safety and Security (NCS4), U.S. sporting venues reported a 25 percent increase in fan-on-fan altercations between 2019 and 2022 (NCS4 Annual Report). A 2023 study published in the Journal of Sports Management found that alcohol-related ejections at NFL stadiums averaged 3.2 per game, with 68 percent occurring after the third quarter when cumulative consumption peaks (Journal of Sports Management). Meanwhile, a UK Home Office report on football disorder noted that 40 percent of arrests at English Premier League grounds occurred in concourse bottlenecks and exit corridors — not in the stands themselves (UK Home Office Football-Related Arrests).
These are not random events. They follow spatial and temporal patterns: late-game alcohol saturation, rivalry-match tribalism, and architectural chokepoints where opposing fans converge. The problem is that traditional surveillance treats every pixel equally and waits for visible violence. It does not model tension.
How Crowd Tension Mapping Works
Crowd tension mapping is the practice of overlaying behavioral indicators — movement speed, crowd density, gestural patterns, acoustic spikes — onto a spatial model of a venue to produce a real-time aggression-probability score for every zone.
Think of it as weather radar for crowd behavior. A meteorologist does not wait for a tornado to touch down before issuing a warning. They read pressure differentials, wind shear, and moisture convergence to predict where a funnel is likely to form. Crowd tension mapping applies the same logic to human behavior in a bounded space.
The core inputs are:
Density clustering. Computer vision models segment the venue map into micro-zones and track how many people occupy each zone per square meter. Research from the crowd-dynamics lab at the University of Greenwich established that pedestrian density above 4 persons per square meter sharply increases the probability of both stampede and interpersonal conflict (Still, G. Keith — Introduction to Crowd Science, CRC Press).
Movement anomalies. Normal crowd flow follows predictable patterns — toward concessions at halftime, toward exits after the final whistle. Tension mapping flags deviations: sudden counter-flow movement, circular clustering (a crowd forming around a confrontation), or rapid dispersal waves.
Acoustic markers. Microphone arrays detect shifts in ambient noise — not words, but volume spikes, frequency patterns associated with shouting, and the sudden silence that often precedes a physical altercation.
Contextual overlays. The system layers in game state (score differential, rivalry intensity, quarter), alcohol-sales data (volume sold per section), and historical incident data for the matchup.
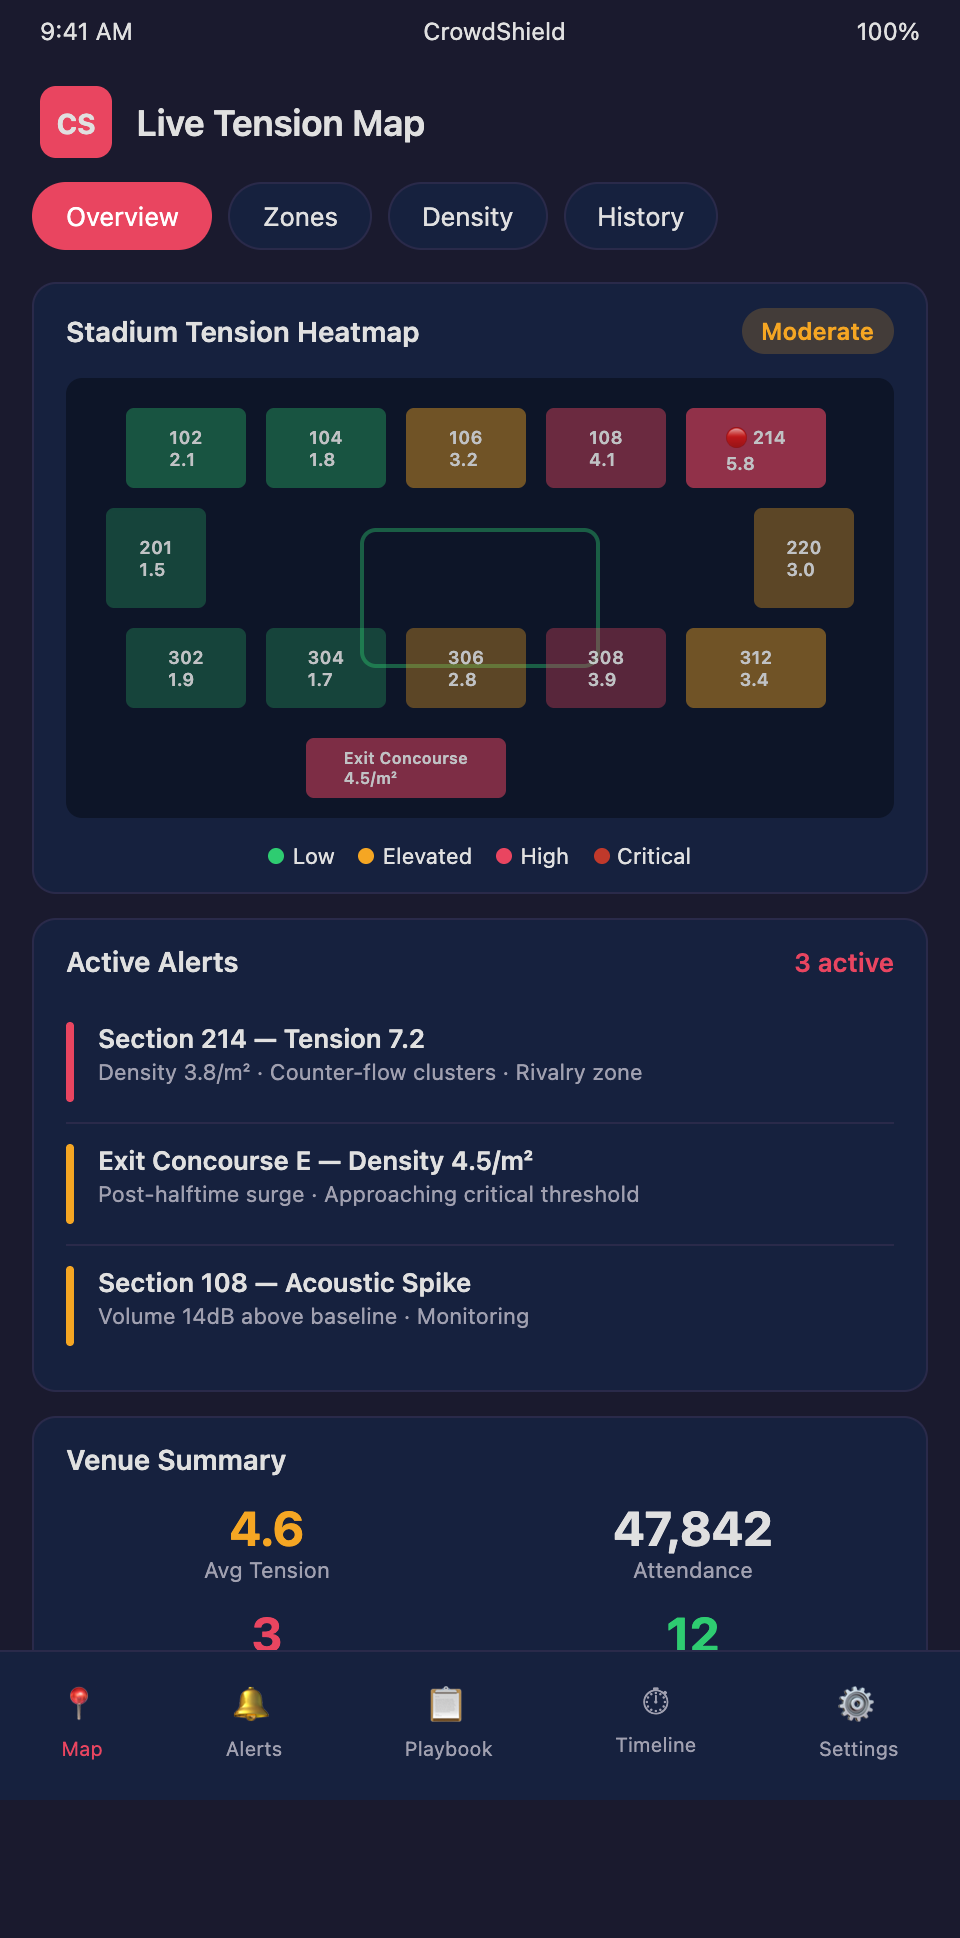
The output is a live heatmap where each zone carries a color-coded tension score. Green zones are baseline. Yellow zones show elevated indicators. Orange zones have multiple converging risk factors. Red zones demand immediate attention.
From Heatmap to Action: The Choose-Your-Own-Adventure Model
A heatmap alone is just a prettier version of a camera wall. The breakthrough is pairing spatial intelligence with branching decision prompts — what CrowdShield calls choose-your-own-adventure playbooks.
When a zone crosses from yellow to orange, the nearest security team member receives a context-specific prompt on their device:
"Section 214 — tension score 7.2. Density above threshold. Two counter-flow clusters detected. Recommended actions: (A) Deploy hospitality ambassador with water. (B) Open auxiliary exit gate 14-C to reduce density. (C) Reposition two officers to section boundary. (D) Escalate to supervisor."
Each choice feeds back into the model. If option B is selected and density drops, the tension score recalculates. If the score continues to rise despite the intervention, the system presents a second-tier prompt with more assertive options. This branching structure turns security from a reactive reflex into a guided, adaptive workflow.
The concept draws on research in structured decision-making under uncertainty. A 2021 paper from the RAND Corporation on event-security frameworks argued that providing field personnel with pre-validated decision trees reduces response-time variance by up to 40 percent compared to unstructured radio dispatching (RAND Corporation — Improving Protective Security Decision-Making).
Scaling and Edge Cases
The most common objection to tension mapping is false positives. A group of fans jumping and shouting after a goal looks, on density and acoustic metrics alone, identical to the early stages of a brawl. This is where contextual overlays earn their value. The system cross-references the spike against game state: if the home team just scored, the model suppresses the alert. If the away team just scored and the spike is in a mixed-seating section, the model raises it.
Another edge case is the "slow burn" — two rival fan groups exchanging verbal abuse over multiple innings or quarters without triggering any single acute metric. Effective tension mapping must track cumulative micro-indicators over time, not just instantaneous spikes. This time-series approach is analogous to how seismologists monitor tremor swarms that individually register below alarm thresholds but collectively signal an impending quake.
Stadium operators considering tension mapping should also plan for integration with existing systems. Most venues already run access-control, point-of-sale, and incident-reporting platforms. For guidance on how spatial data layers connect to these operational systems, see How Spatial Analytics Integrates with Existing Stadium Security Infrastructure.
For a look at how the same tension-mapping principles apply to open-air, multi-stage environments with very different crowd dynamics, see Crowd Tension Mapping for Multi-Stage Music Festivals.
Join the CrowdShield Stadium Waitlist
Stadium security has been stuck in reactive mode for decades. Crowd tension mapping gives your team the spatial intelligence to see fights forming — and the guided playbooks to stop them. CrowdShield is building the incident-prevention engine that stadiums have been waiting for. Join the waitlist to get early access and shape the product with your venue's real-world data.