How Spatial Tension Mapping Works in Nightclub Environments
The Problem: Nightclubs Are Blind Spots for Traditional Security
Every weekend, nightclub security teams across the United States face a near-impossible task. They must monitor hundreds of patrons in dark, loud, tightly packed spaces where aggression can escalate from a spilled drink to a full brawl in under ninety seconds. According to a 2023 study published in the Journal of Substance Use, approximately 40% of nightclub patrons report witnessing at least one act of physical aggression during a night out (Hughes et al., 2023). Research on social drinking groups and risk experience in nightclubs confirms that patron safety perceptions are directly tied to the visibility of active security measures (Social Drinking Groups and Risk Experience in Nightclubs, PMC). The Bureau of Labor Statistics reports that security guards in entertainment venues experience workplace violence at rates five times higher than the national average for all occupations, and OSHA identifies nightlife settings as among the highest-risk environments for workplace violence in the service sector (OSHA Workplace Violence Overview).
Traditional nightclub security relies on a reactive model. Bouncers stand at fixed positions, scan the crowd with their eyes, and respond to incidents after they have already erupted. CCTV systems, while common, produce footage that is difficult to interpret in real time due to low light, strobe effects, fog machines, and dense crowds. A 2022 audit by the International Association of Venue Managers found that fewer than 12% of nightclub CCTV systems were actively monitored during peak hours. The rest served only as after-the-fact evidence collection tools.
The result is predictable. Fights break out, patrons are injured, staff are assaulted, and venues face lawsuits, insurance claims, and reputational damage. The National Institute for Occupational Safety and Health estimates that workplace violence in nightlife settings costs the U.S. hospitality industry over $2.7 billion annually in medical expenses, legal fees, and lost revenue. Nightclub operators need a fundamentally different approach, one that identifies danger before it materializes.
What Is Spatial Tension Mapping?
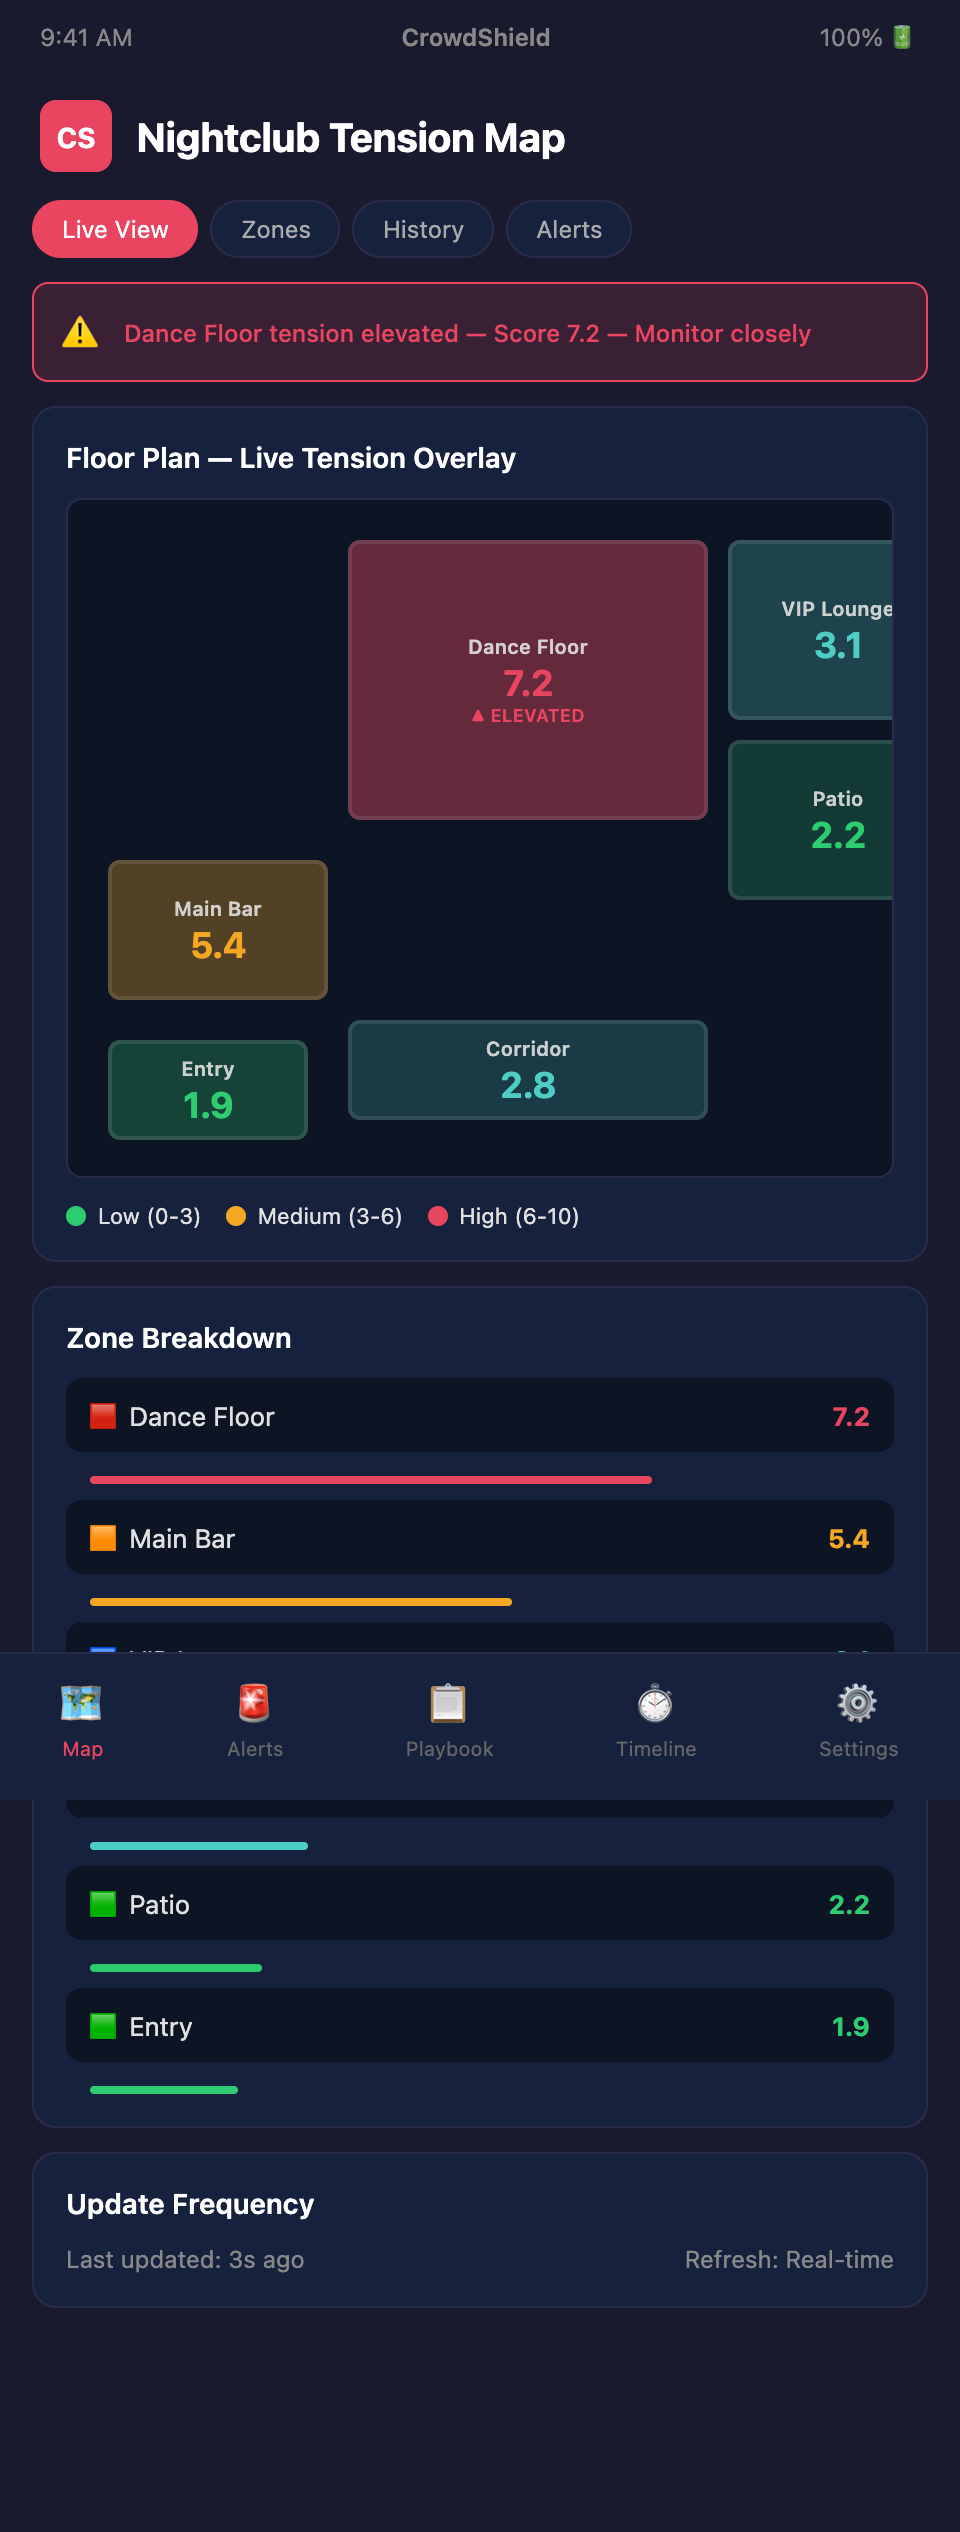
Spatial tension mapping is the core technology behind CrowdShield. At its most basic level, it is the continuous analysis of how people move, cluster, and interact within a defined physical space, translated into a real-time risk assessment. Rather than trying to identify specific individuals or specific threatening gestures, spatial tension mapping focuses on patterns that have been statistically associated with the precursors to violence.
In open-air environments like stadiums or festival grounds, spatial tension mapping relies heavily on overhead camera feeds and GPS-based crowd flow data. Nightclubs demand a fundamentally different sensor strategy. The enclosed, low-light, acoustically saturated environment of a nightclub means CrowdShield must fuse data from multiple input types to build an accurate picture of crowd state.
CrowdShield's nightclub configuration integrates three primary data layers. The first is spatial density analysis, drawn from infrared and thermal imaging sensors that function independently of visible light conditions. These sensors detect body heat signatures and track the number of people per square meter in each zone of the venue. Research from the Fire Protection Research Foundation establishes that crowd densities above six persons per square meter create serious crush risk in enclosed spaces, a threshold corroborated by crowd safety expert Prof. G. Keith Still's analysis of standing crowd density (Standing Crowd Density, Prof. G. Keith Still), but aggression-related incidents begin to spike at much lower thresholds, typically around three to four persons per square meter when combined with alcohol consumption.
The second data layer is movement flow analysis. CrowdShield tracks the velocity and direction of crowd movement through the venue, identifying disruptions in normal flow patterns. When patrons begin to circle a single point, when movement stalls in a corridor, or when two groups move toward each other on converging trajectories, these patterns register as elevated tension signals. A 2021 paper in the IEEE Transactions on Pattern Analysis and Machine Intelligence demonstrated that crowd flow disruptions predict violent incidents with 78% accuracy up to four minutes before physical contact occurs.
The third layer is behavioral acoustic analysis. While the ambient noise level in a nightclub can exceed 110 decibels, CrowdShield's acoustic modules are calibrated to detect anomalous sound events that stand out against the baseline music, such as the sharp percussive signature of glass breaking, the frequency shift of raised voices in confrontation, or sudden crowd gasps. This layer supplements the spatial data rather than replacing it.
The Choose-Your-Own-Adventure Response Framework
Raw data is useless if it does not reach the right person in the right format at the right time. This is where CrowdShield's choose-your-own-adventure prompt system transforms spatial tension data into actionable security decisions.
When CrowdShield's spatial tension map identifies a zone that has crossed a configurable risk threshold, it does not simply sound an alarm. Instead, it delivers a structured decision tree to the nearest security team member through a mobile device, smartwatch, or earpiece. The prompt describes the situation in plain language and presents two or three response options, each with a predicted outcome based on historical incident data.
For example, a prompt might read: "Zone B3 (rear dance floor) shows converging group movement and density spike. Two clusters of 4-5 individuals are closing distance. Tension score: 7.2 out of 10. Option A: Redirect foot traffic by opening the secondary bar in Zone B4, drawing one group away. Estimated de-escalation probability: 68%. Option B: Deploy two floor staff to Zone B3 for visible presence and casual engagement. Estimated de-escalation probability: 74%. Option C: Alert door team to prepare for possible ejection from Zone B3 east exit. Estimated containment probability: 81%."
This framework accomplishes several things simultaneously. It removes the ambiguity that paralyzes security staff in high-pressure moments. It provides options rather than orders, respecting the on-the-ground judgment of experienced bouncers while augmenting it with data. And it creates a documented decision trail that protects both the venue and its staff in any subsequent legal review.
Adapting Spatial Mapping to Nightclub-Specific Challenges
Nightclubs are not simply smaller versions of concert venues or stadiums. They present a constellation of environmental factors that demand specialized calibration of any spatial analytics system.
Light conditions in nightclubs cycle rapidly between near-total darkness and intense strobe bursts. CrowdShield addresses this by deprioritizing visible-light camera feeds and weighting thermal and infrared inputs more heavily. The system's algorithms are trained on nightclub-specific lighting patterns so that a strobe burst does not register as a crowd movement anomaly.
Sound is both a challenge and a data source. The high ambient noise floor makes traditional audio surveillance impractical, but CrowdShield uses differential acoustic analysis, measuring changes relative to the expected sound profile rather than absolute sound levels. When the DJ drops the music for a beat and a section of the crowd produces anomalous sound patterns, that delta is informative even if the absolute volume is lower than during normal play.
Venue layout presents another challenge. Unlike an open stadium bowl, a nightclub is a maze of rooms, corridors, alcoves, VIP sections, and service areas. CrowdShield builds a three-dimensional spatial model of each venue during installation, mapping every zone, choke point, exit, and line of sight. This model is the foundation for all tension calculations, because a density of four persons per square meter in an open dance floor has a different risk profile than the same density in a narrow corridor leading to the restrooms.
Temperature is a frequently overlooked factor. Nightclubs with poor HVAC systems see ambient temperatures climb as the night progresses and the venue fills. CrowdShield incorporates temperature data because research from the University of Manchester has demonstrated a statistically significant correlation between ambient temperature above 28 degrees Celsius and the probability of aggressive behavior in enclosed social spaces. The European Monitoring Centre for Drugs and Drug Addiction similarly identifies venue temperature as a critical health variable, noting that temperatures inside clubs have reached 40 degrees Celsius, creating dangerous conditions especially when combined with substance use (EMCDDA Recreational Settings and Drugs).
Implementation and Integration
CrowdShield is designed to layer onto existing nightclub infrastructure rather than replacing it. Most venues already have CCTV cameras, door-count systems, and point-of-sale terminals. CrowdShield ingests feeds from these existing systems and supplements them with its own sensor modules where gaps exist. A typical mid-size nightclub installation requires the addition of four to eight thermal sensors, two to four acoustic modules, and the CrowdShield processing hub, which can be rack-mounted in the venue's existing server closet or operated as a cloud-connected edge device.
The installation process includes a venue mapping session where CrowdShield technicians walk the space, document the layout, identify high-risk zones based on historical incident data and architectural features, and calibrate sensor placement for optimal coverage. This process typically takes one business day for a venue of up to 10,000 square feet.
For nightclub operators evaluating spatial tension mapping, the key question is not whether the technology works in controlled environments. The peer-reviewed literature is clear on that point. The question is whether it works in the specific, chaotic, sensory-overloaded environment of a nightclub at 1:30 AM on a Saturday. CrowdShield's nightclub-specific configuration is the answer to that question.
For a deeper look at how density management applies specifically to dance floors, see Dance Floor Density Management: When Packed Becomes Dangerous. For how these same integration patterns work in practice, see Integrating Spatial Analytics in Nightclub Security Systems. For how spatial analytics principles scale to larger events, see What Is Crowd Tension Mapping and Why Stadiums Need It Now.
Ready to See Spatial Tension Mapping in Your Venue?
CrowdShield is currently onboarding nightclub and late-night venue partners for early access. If you operate a nightclub and want to move from reactive security to predictive incident prevention, join the CrowdShield waitlist today. Our team will schedule a venue assessment and show you exactly how spatial tension mapping would work in your specific space. Nightclub security does not have to be a guessing game.