The Role of Alcohol Sales Data in Predicting Stadium Violence
The Disconnected Data Problem
American professional sports venues sell an estimated $2.4 billion in beer alone annually, according to a 2023 analysis by Beer Marketer's Insights (Beer Marketer's Insights Annual Report). Every transaction is logged in the point-of-sale system — which vendor, which product, which section, what time. Yet this data almost never reaches the security command center.
The result is a blind spot. Security teams know that alcohol causes problems — the NFL's fan conduct data shows that alcohol is a contributing factor in over 60 percent of ejections (NFL Fan Conduct Policy) — but they have no real-time visibility into where consumption is heaviest. They react to the symptoms (aggression, vomiting, unconsciousness) rather than tracking the cause (cumulative consumption by zone).
This disconnect exists because POS systems and security systems were never designed to talk to each other. The POS system is a revenue tool. The security system is an operational tool. Bridging them requires an integration layer that normalizes both data streams into a common spatial model.
How POS Data Feeds Tension Mapping
When alcohol sales data is overlaid onto a venue's spatial tension map, it becomes a leading indicator rather than a trailing one. The integration works as follows:
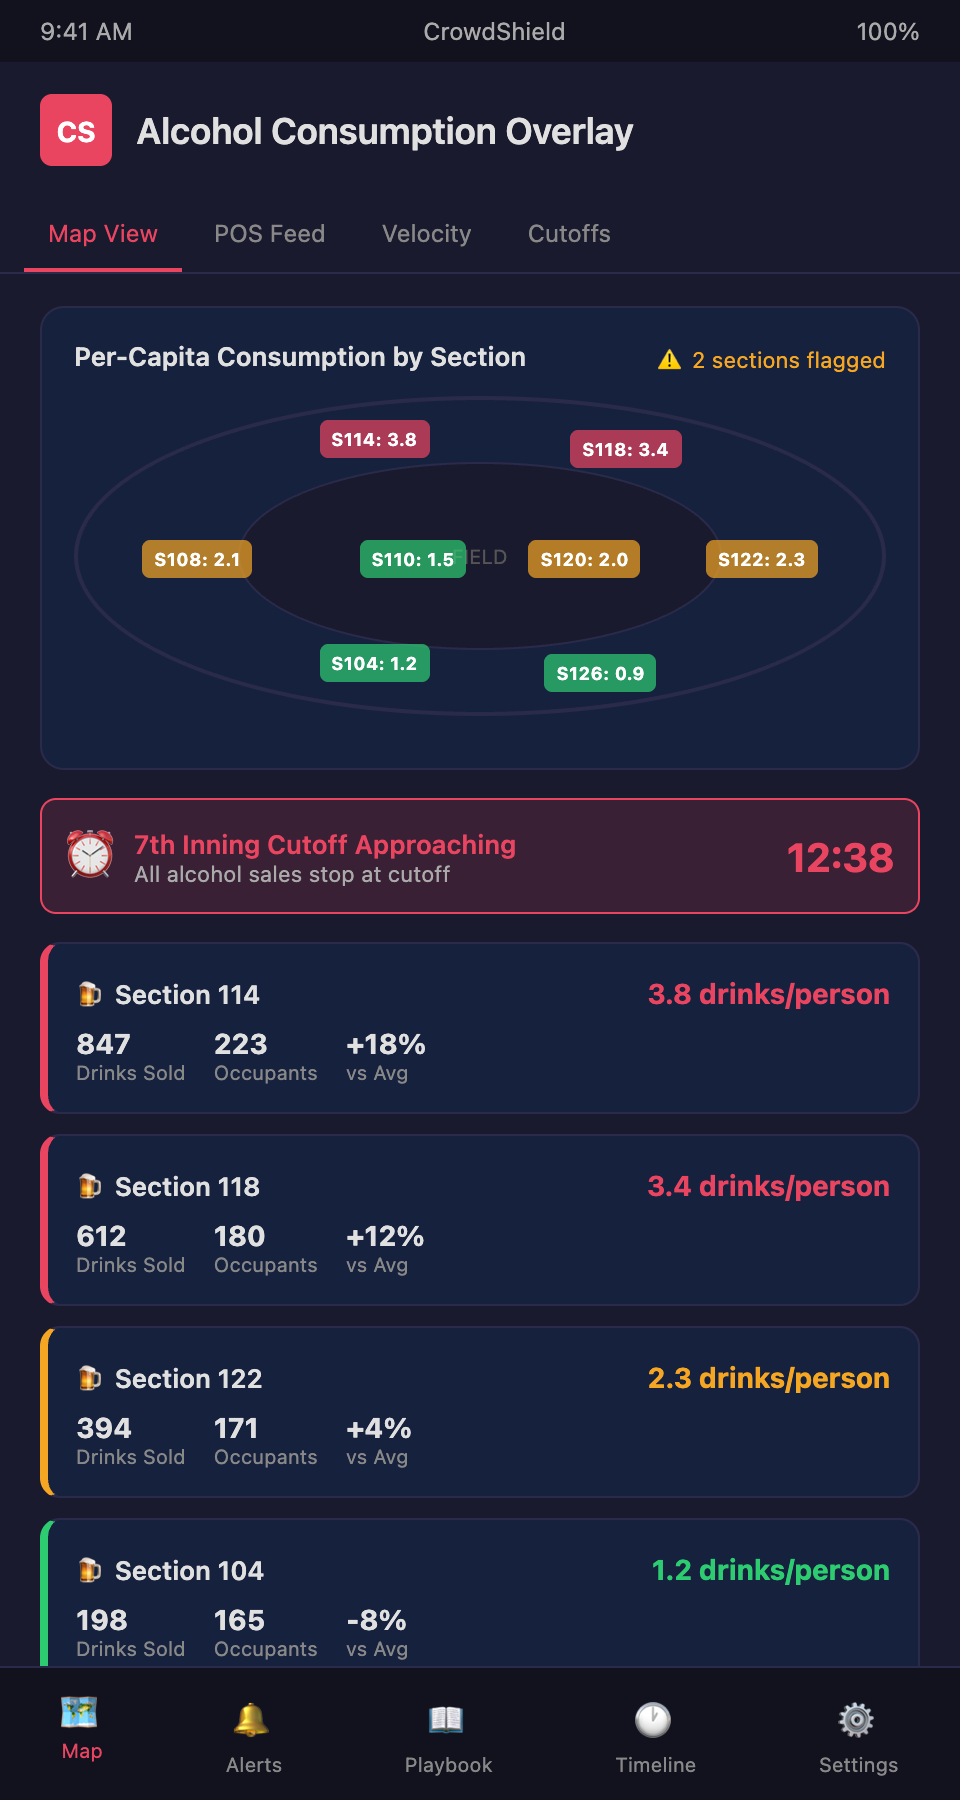
Per-section consumption rates. The system calculates a rolling average of standard drinks sold per ticketed attendee in each section. A section that has consumed 2.8 drinks per person by the fifth inning is in a different risk posture than one at 1.2.
Velocity tracking. Not just total consumption, but the rate of change. A section that jumped from 1.0 to 2.5 drinks per person in a single inning signals binge behavior — a stronger predictor of aggression than steady moderate consumption. Research from the Pacific Institute for Research and Evaluation (PIRE) found that rapid consumption patterns were 2.3 times more likely to be associated with aggressive behavior than equivalent total consumption spread over longer periods (PIRE — Alcohol and Aggression in Sports Settings).
Cutoff compliance monitoring. Most venues enforce an alcohol sales cutoff (typically end of the seventh inning in baseball or third quarter in football). The spatial model can verify compliance by tracking whether transactions cease on schedule across all vendor locations and flagging anomalies.
Interaction with density and game state. Alcohol data alone is informative; combined with density and game context, it becomes predictive. A section with above-average consumption, above-average density, and a rivalry score differential of 3+ runs carries a fundamentally different tension score than the same consumption in a low-density, blowout game.
Case Context: What the Research Shows
The relationship between alcohol and spectator violence is among the most studied topics in sports safety. A landmark 2011 study by the University of Minnesota found that implementing alcohol management policies at collegiate stadiums — including reduced serving sizes, beer-only sales, and vendor training — reduced alcohol-related incidents by 29 percent over three seasons (Lenk et al., Alcohol Policy and Collegiate Sports, Alcoholism: Clinical and Experimental Research, 2011).
In 2016, the Los Angeles Memorial Coliseum partnered with USC researchers to study the effect of real-time consumption monitoring. By tracking POS data per section and deploying additional security to high-consumption zones proactively, the venue reduced ejections by 18 percent during the study period (USC Annenberg Research — Venue Safety and Alcohol Monitoring).
The UK takes a different approach entirely. Under the Sporting Events (Control of Alcohol etc.) Act 1985, alcohol consumption in view of the pitch is prohibited at designated football grounds. The Football Supporters' Association has noted that while this eliminates in-seat consumption as a factor, it concentrates drinking in concourse areas and surrounding pubs, creating different spatial risk patterns (Football Supporters' Association — Alcohol Policy Review).
Implementation Considerations
POS system compatibility. Major venue POS platforms (Appetize, Oracle MICROS, SpotOn) all provide transaction-level APIs. The minimum data required is: timestamp, vendor location, product category (beer, wine, spirits), and quantity. Section attribution can be inferred from vendor location mapping.
Vendor training alignment. POS data can also monitor server behavior. If a specific vendor location shows consumption rates significantly above neighbors, it may indicate lax ID checking or over-serving. This creates a feedback loop between the spatial analytics platform and the venue's responsible-beverage-service program.
Fan-experience balance. Security teams must resist the temptation to use alcohol data punitively. The goal is not to police individual consumption but to understand aggregate zone-level risk. Fans who feel surveilled at the individual level will resist the system. The messaging should emphasize safety, not surveillance.
For an understanding of how density thresholds interact with alcohol-related aggression risk, see Understanding Crowd Density Thresholds and Aggression Risk in Venues. To explore how late-night venues handle the even more extreme end of the alcohol-aggression spectrum, see Managing Alcohol-Fueled Aggression in Nightclub Environments.
Connect Your POS to CrowdShield
Your venue already tracks every beer sold. CrowdShield turns that revenue data into a real-time safety overlay, giving your security team the leading indicator they've been missing. Join the waitlist to see how your POS data can power predictive crowd management.