What 200 Field Trip Days Taught Us About Station Bypass
What One Day of Data Misses
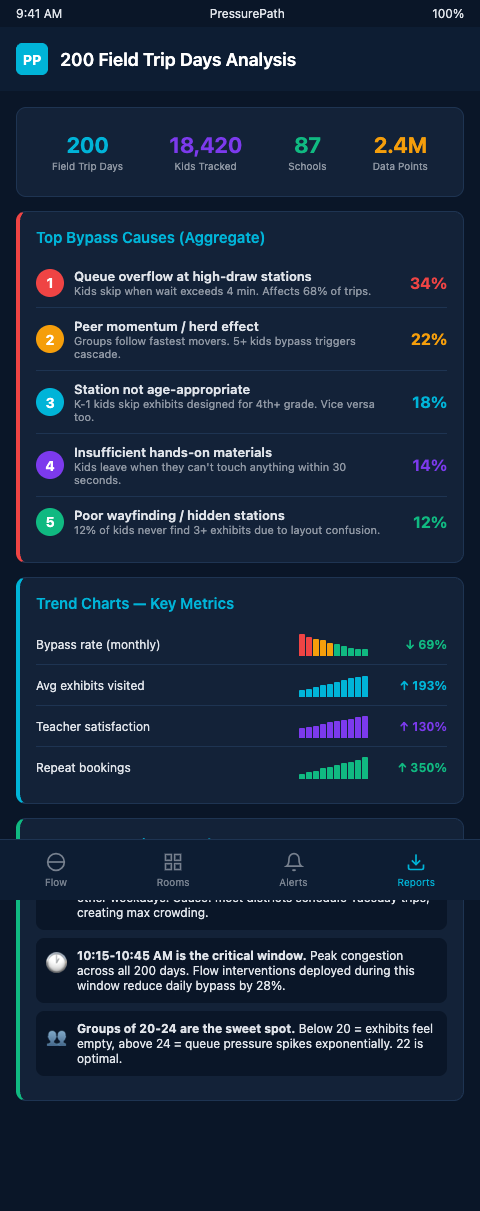
A children's museum exhibit designer observing a single Tuesday in October sees 34 third-graders bypass the Water Cycle puzzle at 10:17 AM and writes up a docent positioning recommendation. It's a reasonable response to a real observation. It's also a single data point in a system that behaves very differently across different days, group types, arrival times, and seasonal contexts.
The bypass events that do the most damage to a museum's educational mission aren't the dramatic ones—the entire group racing to the back of the floor while docents watch helplessly. They're the chronic ones: the station that gets bypassed by 60% of third-grade groups regardless of who's at the door, the arrival-time window between 10:00 and 10:30 AM where school-wave pressure consistently overwhelms the atrium's absorption capacity, the back-to-back booking configuration that generates a double-wave event three out of every five times it occurs.
Those chronic patterns are invisible at single-day observation scale and barely visible at 20-day scale. They become statistically robust around 60 to 80 days, and they're fully reliable decision inputs around 150 to 200 days. The 200-day threshold isn't arbitrary—it's the point where seasonal effects, grade-level variance, and back-to-back booking effects are each represented enough times in the dataset to distinguish signal from noise. PressurePath's longitudinal analysis framework is built around that threshold. The data accumulated at 200 days also becomes the foundation for grant-worthy evidence that IMLS and NSF reviewers recognize as methodologically substantial—a longitudinal behavioral data set rather than a point-in-time snapshot.
How Do Children Engage with STEM (informalscience) establishes the baseline: average interaction at a science museum exhibit runs approximately one minute, and only 15% of children return to an exhibit after leaving it. These are starting benchmarks, but they don't reveal why bypass happens when it does or which structural factors drive it above or below those baselines.
Paying More Attention to Paying Attention (informalscience) defines the key metrics—holding time (how long an exhibit holds a visitor once they stop) and attracting power (what percentage of passers-by stop at all). Both metrics vary substantially across visit types, group sizes, and arrival configurations. Two hundred days of data is what you need to see the variance structure clearly enough to act on it.
Patterns That Only Appear at Scale
PressurePath's longitudinal data analysis framework treats 200 field trip days as a population of school-wave events, not a sequence of individual visits. The pressure-in-pipes metaphor operates at this scale too: you're not analyzing individual bursts but the statistical distribution of burst sizes, entry velocities, and bypass rates across the full population.
Three structural patterns emerged from a 200-day analysis that no single-day observation would capture. Each pattern has a different operational response—and the responses are only defensible when the pattern is visible in the data.
Seasonal bypass cycles. Bypass rates at specific stations follow a predictable seasonal pattern. In September and early October, school groups are field-trip-fresh—students are engaged, teachers have prepared them, the museum visit feels like an event. Bypass rates are lower. By late February and March, school groups arrive more routinely; the museum is a scheduled destination rather than a novelty. Bypass rates at lower-profile stations rise by 15 to 25 percentage points. The Water Cycle puzzle, well-positioned relative to the entry corridor, holds up year-round. Stations in secondary corridors show the steepest seasonal decay.
Tracking and Timing at Children's Museum (WolfBrown) multi-session tracking confirms that toddler groups and young primary groups produce especially high bypass rates, and that these rates are consistent across sessions rather than random. The pattern is structural, not incidental—meaning docent positioning changes help at the margin but don't address the underlying wave-pressure cause.
Grade-specific bypass signatures. Across 200 field trip days, third-grade groups and second-grade groups generated bypass rates at the Water Cycle puzzle that differed by 22 percentage points, even when controlling for group size and arrival time. Fifth-grade groups showed a completely different bypass signature: lower bypass at physically complex stations, higher bypass at stations designed for younger grades. The grade-specific patterns were stable enough across the data set to serve as reliable predictors in PressurePath's booking-calendar wave-forecast model.
Visitor Engagement Bayesian Models (PMC) confirms that Bayesian models using multimodal sensor data can measure dwell time distributions across school-group sessions with sufficient precision to detect grade-level behavioral differences. Without the longitudinal data set, these differences look like noise. At 200 days, they resolve into signal.
Back-to-back booking effects. The 200-day data set contained 43 instances of consecutive school groups arriving within 15 minutes of each other. In 31 of those 43 cases, the second group showed a materially higher bypass rate at the first three stations in its path than comparable groups arriving without a concurrent predecessor. The mechanism is straightforward: the first group's trailing edge is still occupying station space when the second group's leading edge arrives. The second group's leading-edge students, seeing occupied stations, continue to the next available space—which is typically farther back on the floor. The bypass cascade compounds.
Field Trips Long-Term Impact (Academia) documents that bypass of key stations measurably reduces knowledge retention at follow-up testing. The back-to-back booking effect, compounding bypass at your NSF-funded stations, has a direct long-term learning-outcome cost. That's the case for booking stagger protocols that's difficult to make without longitudinal data.
From Patterns to Protocols
The operational value of a 200-day data set is that it lets you move from reactive bypass management to preventive pacing protocols. When you know that back-to-back bookings within 15 minutes generate a bypass compounding effect 72% of the time, you can set a minimum stagger window in your booking system rather than waiting for the effect to appear on the floor.
The 200-day data set also lets you distinguish between bypass problems that are fixed and those that are getting worse. A station with a stable 45% bypass rate is a different problem from a station whose bypass rate has risen from 30% to 58% over two school-year semesters. The trending station is telling you that something structural changed—perhaps an adjacent exhibit was removed, reducing social proof that the area was worth visiting, or perhaps a docent who had been informally redirecting groups changed their position. Without longitudinal data, both stations look like "bypass problems." With it, the trending station is an urgent intervention target and the stable one is a candidate for a lower-cost re-routing fix.
Visitor Engagement with Digital Exhibit (Tandfonline) documents how multi-session research captures visitor pattern shifts across days—the temporal dimension that single-session studies miss. The 200-day PressurePath data set is the children's museum equivalent of that multi-session research: it surfaces the temporal patterns that determine whether your pacing interventions are working or simply masking the underlying structural bypass causes.
Deep Learning for Museum Visitor Behavior (MDPI) shows that deep learning applied to video-derived behavioral data can capture start/end times and exhibit sequences across large datasets—the same data structure that PressurePath's sensor-based collection produces. At 200 days, you have a dataset large enough to train a predictive model rather than relying on manual pattern recognition.
The museum bypass case study documents what's possible when patterns are identified and addressed: a 60% bypass reduction at the Water Cycle puzzle through targeted pacing interventions. That result was achievable in one semester because the underlying patterns were structurally consistent. Two hundred days of prior data would have made those patterns visible earlier and shortened the time to intervention.
For the 60,000 group runs parallel: escape room operators with large group-run datasets have identified pacing leak patterns that are invisible at small sample sizes. The children's museum equivalent—200 field trip days—is the scale at which structural bypass causes become statistically separable from random visit variance.
At 200 days of flow data, you have a longitudinal evidence base that NSF and IMLS reviewers recognize as methodologically rigorous. The patterns you surface at scale are the evidence that your pacing interventions are producing durable, reproducible improvements rather than one-semester flukes.
Start Building the Data Set You'll Need in Year Three
One practical aspect of building the 200-day data set deserves direct attention: what to do with the data during the first two semesters before it's large enough to be statistically reliable for pattern detection. The answer is to use the early data for session-level operations—watching for individual high-bypass visits and responding with docent adjustments—while flagging the emerging patterns as hypotheses rather than conclusions. A station that shows high bypass in the first 20 school-group sessions might be structurally bypassed or might be exhibiting early-semester novelty effects. The 200-day data set confirms which it is.
PressurePath's analysis framework includes confidence intervals on its pattern detection: as the data set grows, the system tightens those intervals and transitions from "preliminary observation" to "statistically reliable finding." That progression from early-stage signal to high-confidence pattern is the arc of building a 200-day data asset. The investment begins immediately and compounds with each visit logged.
Children's museum exhibit designers who start collecting structured flow data now will have a 200-day evidence base two school visit seasons from now—data that prevents bypass, supports grant applications, and informs capital investment decisions simultaneously. PressurePath is the collection and analysis infrastructure that makes that data set actionable rather than overwhelming. Join the waitlist to begin the accumulation.