How to Forecast Bloom Set After a Brine Intrusion Event
Bloom Set Isn't Linear After a Brine Event
Growers assume that a brine intrusion event equals lost flowering. The literature tells a more textured story. A Frontiers in Plant Science review on citrus flowering established that floral induction is triggered by water-deficit and low-temperature signals two to three months before sprouting (Frontiers: Advances in Citrus Flowering Review). A ScienceDirect study on multiple abiotic stresses including salinity in citrus documented that moderate salinity can enhance flowering after stress relief — brine events are not a total loss if they're managed (ScienceDirect: Multiple abiotic stresses with salinity citrus).
The hormonal machinery explains why. A Frontiers review on ABA and gibberellins in plant development showed the two hormones jointly mediate floral transition, with ABA spiking under salinity, flooding, or drought (Frontiers: ABA and Gibberellins Antagonistic Plant Development Abiotic Stress). A PMC review on GA in citrus flowering and fruiting added that GA antagonizes ABA and that GA treatment during induction reduces flower number (PMC: Gibberellic Acid in Citrus Flowering and Fruiting Review). The forecaster's job is to read where a specific brine event lands on the induction timeline and project its consequences for bloom count.
The commercial stakes sit in forward contract pricing. Brokers and juice plants are pricing the next season's harvest in the weeks and months after the storm, and a bloom-set projection that's wrong by 20% means the grove is either overselling fruit it can't deliver or underselling fruit that shows up anyway. A rigorous post-brine bloom forecast lets growers price forward contracts against a defensible expected-yield band — and lets brokers work with a seller whose numbers hold up at bloom-count time.
A grove with a habit of over-promising after brine events ends up with strained broker relationships and discounted forward pricing in subsequent seasons. A grove with a documented bloom-forecast methodology and a track record of hitting projected bloom counts earns premium placement with stable buyers. Over multi-year relationships, the compounding value of forecast accuracy shows up as materially higher realized prices, which is why the bloom-set forecast needs to be treated as a commercial asset rather than only an internal agronomic exercise.
Forecasting Post-Brine Bloom on the Helm-Charted Yield Forecast
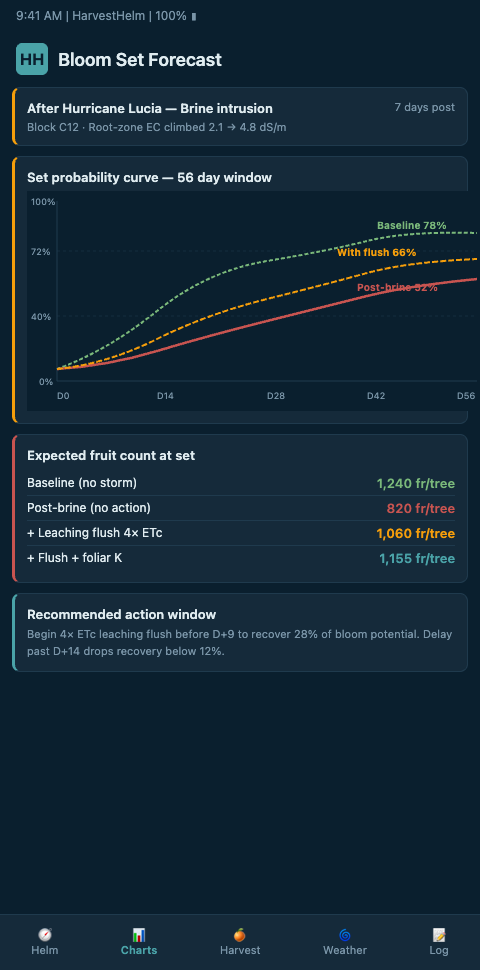
HarvestHelm frames bloom-set forecasting as a 90-day downstream projection on the yacht navigation dashboard. The helm-charted yield forecast shows the captain how a salt event shifts the induction hormone balance, and projects a bloom-count band for the affected blocks two to three months forward. The dashboard reads ABA-GA balance as the keel angle — when it tips too far one way, the chart re-projects bloom set.
The forecast inputs:
- Event salinity dose. EC-based integral of the brine exposure — not peak EC alone.
- Induction-window timing. Whether the event lands inside the 60-90 day induction window or outside it.
- Tree water status. Recovery rate through post-event irrigation and drainage.
- Rootstock-scion response. Mandarin-Cleopatra pairings recover bloom potential differently than navel-Swingle pairings — the mandarin navel resilience comparison drives how adjacent rows weight into the same 90-day projection.
- PGR program posture. Whether the grove plans post-event plant growth regulator support.
Citrus Industry's reporting on post-hurricane fruit drop and PGR programs documents the intervention stack for managing set after storm and salt stress (Citrus Industry: Reduce Post-Hurricane Fruit Drop With PGRs). HarvestHelm integrates PGR schedules into the forecast — a grove running Gibberellic-Acid foliars in the right window sees a different bloom-count projection than one running a standard program.
UF/IFAS EDIS HS1399 summarizes the extension guidance for water-stress timing and inputs to improve flowering after stress events (UF/IFAS EDIS HS1399: Management Options for Improving Flowering in Citrus), and Citrus Industry's reporting on mandarin blooming and fruit set shows that only 1-5% of flowers become harvestable fruit — so the forecast models both the bloom count and the set ratio (Citrus Industry: Understanding Mandarin Blooming and Fruit Set Requirements). A moderate brine event can push bloom count up while pushing set ratio down; the helm chart shows the two curves together so the captain can read net yield.
The mechanism behind the biphasic response matters for operational decisions. Light-to-moderate salt stress during the induction window creates a short-lived water-deficit signal that reinforces the normal floral-induction cue — the ABA spike helps push the tree into reproductive mode. Severe salt stress, by contrast, impairs the machinery required to convert that induction into a healthy bloom; the flowers that do emerge show reduced viability and set ratio. HarvestHelm models the dose-response curve per cultivar so the captain can see the shift from enhancement to impairment rather than projecting a simple penalty.
A worked forecast. A Murcott block takes a moderate brine event in mid-October — approximately 4 days of sustained onshore aerosol at low-to-moderate load, followed by a flush. The HarvestHelm bloom projection 90 days forward shows a bloom count roughly 8% above the grove's multi-year average (the moderate-stress enhancement effect), with a set ratio roughly 3% below average (residual stress hitting pollination and set). Net projected yield: roughly 5% above average, but with an unusually wide confidence band. The captain can hold forward-contract pricing against the higher net, but also plan for the set-ratio downside scenario by watching pollination-window weather closely.
Contrast the same analysis applied to a Navel-on-Carrizo block that took a more severe brine event earlier in the induction window — say, a 7-day onshore episode with high aerosol load followed by incomplete flush. HarvestHelm's 90-day projection shows a bloom count 15% below average (the severe-stress impairment effect) with a set ratio 8% below average and a wide confidence band. Net projected yield: roughly 25% below average. The captain uses this projection to trigger pre-emptive forward-contract hedging, to adjust packinghouse labor planning, and to flag the block for enhanced post-bloom PGR attention. The action is not inevitable because the number is bad; it's deliberate because the number is early, explicit, and attached to a decision set the captain can actually execute.
Advanced Tactics: Reading Cultivar Response and Downstream Yield
Different cultivars respond to post-brine induction differently. Mandarins typically show stronger flowering rebound after moderate stress; navels can lock into a narrower bloom window. The same brine event produces different 90-day bloom projections on adjacent Murcott and Navel rows, and the cultivar-specific weighting flows into the forecast automatically from the scion-rootstock record.
The forecast feeds directly into downstream split risk. Brine-stressed rinds behave differently when post-storm freshwater flush arrives. Growers forecasting bloom set should run the projection alongside the post-storm fruit split risk chart so the captain sees both the inbound bloom and the outbound split risk on one helm.
Cross-niche, the peak-stress-induction signal is a shared discipline with desert operators reading peak-heat pollination conditions in date palm. Both systems forecast reproductive output from an abiotic-stress baseline. Common forecasting pitfalls:
- Modeling bloom count linear in event severity — the relationship is biphasic.
- Ignoring the timing of the event relative to induction.
- Over-crediting PGR programs without a clear protocol.
- Missing rootstock-specific recovery curves.
- Failing to reconcile the bloom-count forecast against set-ratio forecasts — bloom counts alone do not predict harvest.
- Not updating the forecast as post-event sensor data lands — a static forecast loses precision each week.
A multi-season calibration discipline sharpens the forecast. A grove that has logged bloom-count and set-ratio outcomes against specific brine-event characteristics across three or more seasons produces a grove-specific response curve that outperforms published averages. HarvestHelm captures these observations and feeds them back into the forecast so each grove's chart reflects its own history, not just the literature baseline. Growers with deep historical records report the single-grove forecast converging to within 10% of actual bloom counts by the third season.
PGR program integration is the last major lever. Growers running Gibberellic-Acid foliar applications at specific induction-window timing see different bloom responses than growers running a reactive post-bloom PGR program. HarvestHelm maps the PGR schedule against the induction window and the brine-event timing to produce a combined projection. The helm chart shows the captain: here's what bloom looks like without PGR intervention, here's what it looks like with the current program, here's what it would look like under a shifted program. Running all three on the same chart lets the captain tune the PGR plan for maximum forecast uplift — and forward-contract on that uplift with confidence.
Inventory-planning implications reach into the packinghouse. A post-brine bloom that projects 5% above average with a wider confidence band tells the packinghouse to plan for a higher mid-range throughput with flexible capacity at the edges. A projection of 10% below average tells the packinghouse to tighten its labor and dispatch scheduling. The helm chart generates the projection early enough — typically 90 to 120 days before bloom count is observable — that downstream supply-chain planning can adjust. Growers and packinghouses who coordinate around the helm chart's forecast rather than waiting for bloom-count reality produce smoother throughput and better cost control across the season. That coordination is the commercial payoff of getting the post-brine forecast right.
Get Early Access to the Coastal Citrus Grove Dashboard
Coastal grove owners hit by brine events and trying to price forward contracts against uncertain bloom sets are working with HarvestHelm now. The helm chart gives you a 90-day bloom projection with confidence bands and cultivar-specific response curves. Join the Coastal Citrus Grove waitlist with your last brine-event record, current PGR program, and cultivar-rootstock mix — we'll build out your bloom forecast and integrate it with your existing set-ratio records. Operations onboarding before the October-January induction window get their 60-90 day floral-induction model calibrated against cultivar-specific dose-response curves, so Murcott-on-Cleopatra enhancement effects and Navel-on-Carrizo impairment thresholds are priced per block before the next storm.
Day one of your dashboard shows the ABA-GA hormonal balance read as a keel-angle indicator, the event-salinity integral from recent onshore episodes, and the paired bloom-count and set-ratio curves that predict net yield rather than either metric alone. Growers sending three seasons of bloom-count and set-ratio history against documented brine events see their grove-specific response curve converge inside the first induction window, typically hitting within 10% of actual bloom counts by year three. Forward-contract brokers working with HarvestHelm clients see the 90-day projection export directly into their price-negotiation workflow, so the bloom-set forecast becomes a commercial asset the packhouse labor planning team can stage against by February.