Spectrophotometer-Informed Soundboard Work on Stage Fade
Why Visual Assessment Falls Short
Two conservators looking at the same faded aniline magenta bodice under the same examination lamp can disagree by 12 delta-E on their estimate of the original saturation. Neither is wrong in any naive sense — both are making calibrated assessments informed by experience. But 12 delta-E is a visible difference at normal viewing distance, and it is large enough to produce meaningfully different restoration targets.
The disagreement arises because visual assessment cannot separate substrate color contribution from dye overlay loss. A yellowed silk ground that has aged from near-white to a warm cream adds orange-yellow chroma to the measured hue, making a faded magenta read more peachy than it actually is relative to the original dye. An archivist compensating for that yellowing by eye may over-correct the saturation target, or may under-correct it by attributing some of the peach shift to the original dye formula.
Reflectance spectroscopy's non-contact role in heritage object monitoring is well established in conservation science precisely because it makes the substrate-dye separation an objective measurement rather than a judgment call. FORS readings taken at the substrate and the dyed areas respectively produce separate spectral curves that Fadeboard can use to isolate the dye channel from the ground channel when setting fader values.
Instrument Setup for Archive Sessions
The most accessible spectrophotometer configuration for theater archive work is a fiber-optic reflectance spectroscopy (FORS) setup with a spot size between 3 mm and 8 mm — large enough to average across minor textile weave variation, small enough to stay within a single color area on complex surface decorations.
Cultural Heritage Science Open Source's FORS workflow documentation covers the standard setup: a tungsten-halogen light source, fiber bundle probe, spectrometer with 400–750 nm wavelength range, and a white reference standard calibrated before each session. For theatrical costumes with high surface variation — velvet pile, sequined trim, woven brocade — multiple readings per color area should be averaged, with the standard deviation noted to flag areas where surface heterogeneity is high.
Before opening the Fadeboard session, take three reference measurements: the substrate in an undyed area where one is accessible (a seam allowance, lining edge, or back of hem facing), the most-faded area within each primary color region, and the least-faded area within each primary color region. These three readings establish the degradation gradient that the Time Degradation fader should represent.
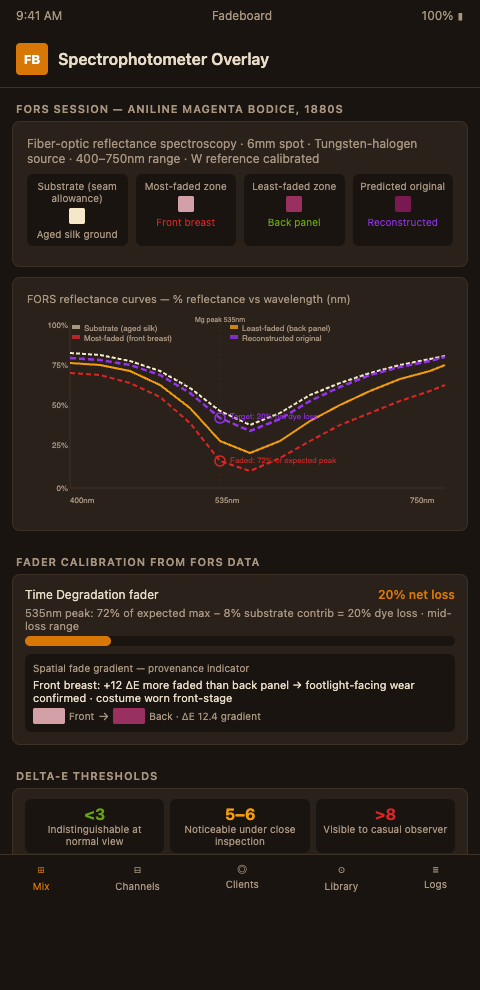
The difference between the most-faded and least-faded readings within a single color area is often informative about the stage exposure geometry. A bodice that was worn facing forward under footlight beams shows more fade at the front breast area and less at the back — a spatial fade gradient that the FORS readings quantify directly and that the session log should record as a provenance indicator.
Translating Reflectance Data Into Fader Settings
A raw FORS reading returns a percentage reflectance curve plotted against wavelength. Fadeboard accepts this data as a session input and performs the CIELAB conversion internally, but the archivist must still set the interpretive fader values based on what the curves show.
The FORS and multispectral imaging study of silk dyed samples before and after aging demonstrates the characteristic spectral signatures of common stage dye families under various aging conditions. Aniline magenta shows a primary absorption peak around 530–540 nm that diminishes predictably with UV exposure, leaving a residual curve weighted toward the longer red wavelengths. Logwood black shows absorption across the full visible range that compresses as the logwood-iron complex breaks down, shifting toward warmer grey-browns. Knowing these signatures allows the archivist to read the FORS curve and identify which degradation pattern is present.
Setting the Time Degradation fader involves comparing the current FORS curve against the predicted original curve for the identified dye family. If the current peak absorption at 535 nm is 72% of the expected maximum for an unmordanted aniline magenta on silk, and the substrate contribution accounts for 8% of that reduction, then the net dye loss is approximately 20% — which translates to a Time Degradation fader setting in the mid-loss range rather than the high-loss range that a purely visual assessment might suggest.
The delta-E CIELAB measurement reference from Just Paint provides the practical threshold calibration: a treatment target within 3 delta-E of the session's FORS-derived original-state estimate is perceptually indistinguishable from the goal at normal viewing distance; a gap of 5–6 delta-E is noticeable under close inspection; anything above 8 delta-E is visible to a casual observer.
Handling Metamerism in Spectral Sessions
Stage fade analysis intersects with metamerism in a specific way that pure spectrophotometry cannot resolve without the lighting-era translation layer. A FORS session accurately measures the current reflectance curve of the faded dye, but the restoration target must be expressed in terms of how the restored color should read under the specific illuminant at the display or loan destination.
Two restored surfaces can have identical FORS curves under D50 measurement illuminant and still appear different under the archive's 5600K LED examination lamp, because their underlying dye chemistry responds differently to the LED's spectral power distribution.
Fadeboard's lighting-era translation channel addresses this by applying the destination illuminant's spectral power distribution to the FORS-derived restoration target before generating the final color recommendation. The result is a target that is specified not just as "reflectance curve X" but as "reflectance curve X under illuminant Y" — a format that is both instrumentally verifiable and practically meaningful for exhibition planning.
For aniline silk stability analysis that follows spectrophotometer-based staging, this distinction matters at the molecular level: the restored dye compound's reflectance curve under accelerated aging will predict differently than the original's because restoration materials typically use more photostable analogs of the original aniline chemistry, and those analogs have different spectral power responses.
Monitoring and Re-Measurement
A spectrophotometer-informed session creates a baseline that enables meaningful re-measurement over time. Unlike a purely visual assessment, a FORS baseline allows the archive to detect color changes below the threshold of visual detection — typically 2–3 delta-E changes that would not be noticed without measurement but that indicate active ongoing degradation.
The recommended re-measurement schedule for treated theatrical costumes on active loan rotation is: immediately post-treatment (within one week of treatment completion), at six months, at twelve months, and annually thereafter. Each re-measurement creates a new session version that compares the current FORS reading against the post-treatment baseline, flags any delta-E increase beyond 2 units, and triggers a storage or display condition review if that threshold is breached.
For the LED vs incandescent color shift prediction work, re-measurement at loan return provides empirical data on whether the predicted metamerism shift matched the actual shift observed in the destination venue's lighting — data that improves the archive's translation channel calibration for future loans.
Raman metallic-ground work in ecclesiastical conservation applies the same spectral measurement logic to a different material family — the integration of instrument data into fader calibration is consistent across the two niche contexts.
If your archive is currently setting Fadeboard fader values from visual assessment alone, join the Fadeboard waitlist and start a FORS-integrated session for your next intake. Schedule the intake and post-treatment measurements into a single longitudinal record, and the resulting baseline data will significantly improve the precision and defensibility of your session targets. The instrument investment is modest relative to the collections value it protects, and the resulting record satisfies the colorimetric documentation requirements that peer institutions and loan partners are increasingly expecting as standard practice.