Economics of Exhibit Investment: Why Pacing Beats Adding Stations
The Capital Campaign Trap
The framing that most children's museum exhibit designers bring to a bypass problem is: the exhibit isn't engaging enough, so we need to improve it or add more options nearby. That framing has a built-in bias toward spending—better content costs money, new stations cost money, and capital campaigns are a familiar institutional mechanism for raising that money. The pacing framing is different: the exhibit might be excellent, but the wave pressure routing it away from the station means students never reach it. The fix isn't capital—it's operational intelligence about how the floor's pipe network is directing wave pressure.
A children's museum completes a capital campaign to fund three new interactive stations. The installations go in during the summer. The first school groups arrive in September. By October, the exhibit design team notices that two of the three new stations are getting bypassed at the same rate as the old stations they were meant to supplement. The bypass problem didn't go away—it scaled with the new stations.
This pattern is common enough to have a structural explanation. When a 30-kid school wave enters your floor as a high-pressure burst, it doesn't distribute evenly across available stations. It follows the path of least resistance. Adding stations doesn't change the fluid dynamics of that wave unless the new stations are positioned specifically to absorb pressure at the bypass point. Most capital additions aren't positioned with wave pressure in mind—they're positioned based on content logic, donor preference, or available floor space.
Interactive Museum Installations: ROI (Utsubo) establishes the cost baseline: single-station interactives start at $20K, and museums using digital exhibits report 55% longer engagement times—but only when visitors actually reach the station. Engagement uplift numbers assume capture. They don't account for structural bypass before the visitor reaches the station's approach corridor.
Costs and Funding of Exhibitions (Smithsonian) provides federal-level cost benchmarks for comparing station-addition spend against alternative investments. Those benchmarks rarely include the opportunity cost of pacing fixes that weren't implemented because the capital budget went to new fabrication instead.
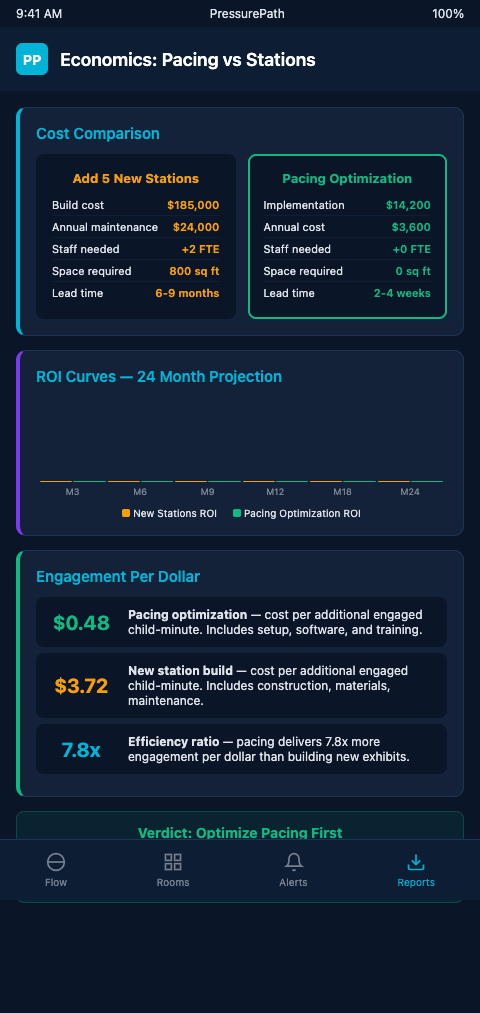
The Pacing-vs-Addition Calculation
PressurePath frames this as a pressure-drop investment question. Every dollar you spend on a new interactive station buys you additional valve capacity in the pipe network of your floor. Every dollar you spend on pacing infrastructure—wave detection, stagger protocols, partition repositioning, booking-calendar integration—buys you better pressure distribution across the valve capacity you already have. The two are not equivalent investments.
The hydraulic analogy is precise: if your floor's pipe network has structural bypass routes that channel wave pressure away from your existing stations, adding more stations doesn't fix the bypass routes. The new stations sit on the same underperforming branches. Pacing investment, by contrast, addresses the routing problem directly—and the valve capacity you already own starts performing closer to its theoretical maximum.
Renovating Museum with Technology (Electrosonic) documents a case where augmenting existing exhibits increased capture rate 9.54 times while saving fabrication cost. The investment wasn't new stations—it was better routing of visitor attention toward stations that already existed. That 9.54× figure is the pacing-investment return on capital already deployed.
Economic Value of Museum Experiences (Springer) estimates that museums generate $100 to $200 in community value per dollar invested. If pacing efficiency increases the engagement rate of your existing stations by 40%, that multiplier applies to a larger base of actual engagement rather than theoretical capacity. The community value return on pacing investment compounds through the stations you already have, not just new installations.
Interactives and Visitor Learning (Wiley) establishes the engagement quality case: active manipulation improves recall over passive observation. That finding only materializes for kids who actually reach and engage with the interactive station. A bypass event doesn't just cost a visit—it costs the learning outcome that justified the station's original capital investment.
The investment tradeoff sharpens when you model it at the floor-wide level, which is one of the use cases for scaling 40-exhibit floor analysis: on a 40-exhibit floor with chronic bypass at seven stations, the capital cost of fixing those seven stations through new fabrication might reach $500K. The cost of a pacing infrastructure investment that improves wave distribution across all seven stations simultaneously might be $15K to $40K.
A useful framing for exhibit designers presenting this to their boards: the pacing investment doesn't replace station-addition investment—it sequences it correctly. Before you spend $80K on a new Robotics Lab station, run a wave-pressure analysis on where that station will sit in the flow network. If the model shows it will sit in a high-pressure corridor that already captures 70% of school waves, the addition has strong ROI. If it shows the station will sit at the end of a secondary branch that currently sees 25% of wave pressure, you're spending $80K to add capacity on an under-pressured branch. The pacing analysis comes first; the fabrication decision follows.
Building the Business Case for Your Board
Museum boards and capital campaign committees are familiar with fabrication cost arguments. They're less familiar with pacing-investment arguments because the ROI framework for pacing is harder to articulate without flow data. PressurePath gives exhibit designers the quantitative language to make the case.
Measuring Organizational ROI (ILI) provides frameworks for quantifying museum learning ROI in the vocabulary that funders and boards recognize. The key translation: bypass rate is the inverse of capture rate, capture rate drives learning outcomes, and learning outcomes are what justify both capital station investments and operating budgets. Pacing infrastructure that raises capture rate improves ROI on all prior capital simultaneously.
The board presentation version of this argument runs as follows: your floor currently has $2.3M in installed interactive station capital. Your average bypass rate on school-wave days is 67%. That means 67% of your station capital is not delivering its intended educational return during your highest-attendance sessions. A $25K pacing investment that drops bypass to 35% on school-wave days unlocks $770K in previously under-performing capital. No new fabrication required.
That framing shifts the conversation from "should we invest in pacing tools" to "we're currently experiencing a $770K capital utilization problem." Board members who think in capital terms rather than operations terms respond to the second framing. The pacing investment isn't an operations expense—it's a capital recovery mechanism. PressurePath's analysis produces the specific bypass rate and capital exposure numbers that make that case concrete rather than theoretical.
Augmenting Outdated Museum Exhibits (ScienceDirect) shows that digital augmentation produces measurable improvements without full station replacement cost—a parallel path to the pacing argument for exhibit designers who need to show capital stewardship to their boards while pushing for flow infrastructure investment.
This economic framing connects directly to grant-worthy evidence: when you present NSF or IMLS with data showing that your pacing infrastructure raised engagement at a funded station from 17% to 61% capture rate without additional fabrication spend, you're demonstrating capital efficiency that grant programs explicitly reward. That kind of documented efficiency—existing investment utilized more effectively through operational intelligence rather than additional capital—is increasingly what multi-year grant renewals require to compete.
The buffer capacity economics framework developed for escape room franchises applies here with minor adaptation: the question isn't how much capacity you have but how much of that capacity is accessible to the waves you're actually receiving. Pacing investment answers that question by closing the gap between theoretical capacity and realized engagement.
One more dimension of the pacing investment case: staffing. A museum that addresses its bypass problem through additional docents at chronically bypassed stations is spending $18 to $22 per hour per docent to compensate for a structural flow problem. If three stations require a dedicated docent each on school-wave days, that's roughly $55 per school-group visit in docent labor specifically allocated to a flow problem rather than to educational programming. A $25K pacing investment that eliminates those three dedicated-docent positions through structural bypass fixes has a two-year payback on staffing alone—independent of the station-engagement ROI calculation.
Stop Leaving Installed Capital on the Table
The economic argument for pacing investment also addresses a timing problem that children's museum exhibit designers frequently encounter: capital campaign cycles and grant renewal cycles both happen every three to five years. Pacing investment can be made in any year, at a fraction of capital campaign scale, and its ROI accrues continuously rather than in a single installation event. That means a museum facing a two-year wait for its next capital campaign can improve station engagement performance substantially during the interim—without waiting for fabrication funds.
The sequencing implication is direct: run a PressurePath pacing audit before the capital campaign planning process begins. The audit identifies which bypass problems are addressable through pacing investment (and can be resolved before the campaign) and which are structural enough to warrant capital inclusion. That sequencing ensures the capital campaign is solving the problems that actually require capital, rather than solving operational problems at capital scale.
If your museum has bypass rates above 50% on school-wave days, your installed station capital is underperforming—and adding more stations won't fix it. PressurePath is built for children's museum exhibit designers who want to make the economic case for pacing investment before the next capital campaign. Join the waitlist to see the exhibit investment ROI model applied to your floor.