What 60 Performances of Drift Data Taught Us About Scene Design
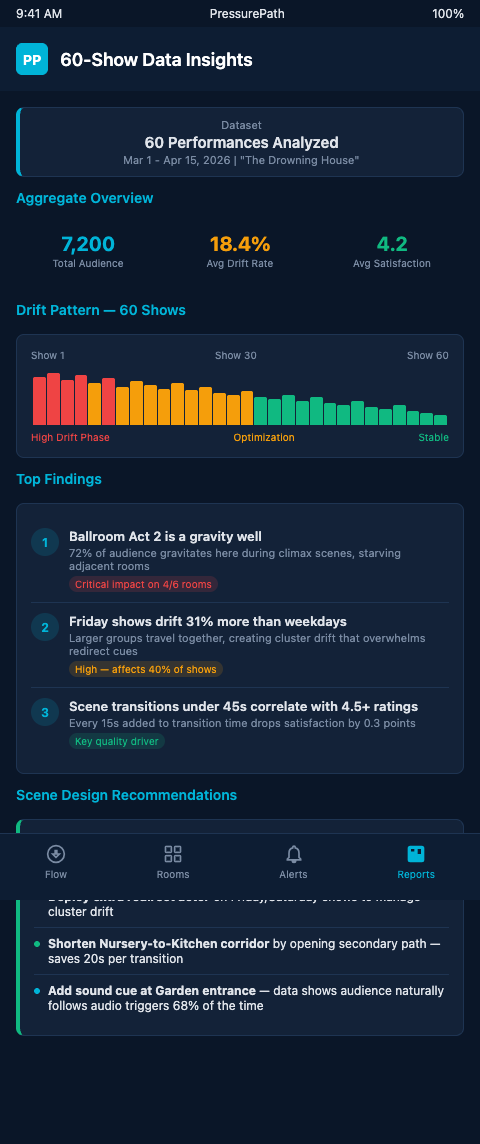
Performance 1 to Performance 60: The Distribution That Emerged
The design team's pre-show distribution model was built on technical rehearsal observations and intuition. Act 2's central confrontation scene — placed in the largest room with the highest audio spectacle — was projected to hold 30-40 audience members consistently. The garden corridor scene, a transitional space connecting two main scenes, was projected to hold 5-10 at any given point.
By performance 15, the data was clear: the confrontation scene was averaging 22. The garden corridor was averaging 28. Audience members were stopping in the transitional space, drawn by an acoustic element — water sounds from an offstage source — and staying for 8-12 minutes, which was 4-6 minutes longer than the design anticipated. The confrontation scene, meanwhile, was losing population to the garden corridor because bodies in motion toward Act 2 were pausing rather than proceeding.
Then She Fell ran 4,444 performances over 7.5 years, generating scene-by-scene behavioral data on 15-person cohorts (Third Rail Projects) — at that scale, patterns emerge that are invisible at 15 or 20 performances. The 60-performance dataset is a meaningful sample: enough repetitions to identify structural patterns rather than nightly variation, but close enough to the early run that corrections can still reshape the production's character.
The Three Patterns That Emerged Across 60 Performances
Pattern 1: Transitional spaces with unintended acoustic signatures become de facto scenes. The garden corridor water sound was never meant to be a draw — it was bleed from a nearby set piece. But at a scene head count level, it functioned identically to a designed scene: it pulled audience members, held them for a dwell time, and released them on their own schedule rather than on the call sheet's cue. Place schema theory shows that drift patterns emerge consistently across performances tracked longitudinally (Audience Behavior, Bilkent) — the acoustic element created a spatial schema that audience members returned to repeatedly, even on second or third visits to the production.
Pattern 2: Magnetic pull decays faster than expected for high-spectacle scenes. The confrontation scene's acoustic and visual intensity was high, but the decay rate — how quickly returning audience members chose other routes rather than revisiting it — was steep. By performance 20, the confrontation scene was averaging 19 viewers, down from 22 at performance 15. By performance 40, it had stabilized at 16. Expression correlation across performances predicts which scenes pull vs repel crowds over time (Audience Facial Expression Correlation, ScienceDirect) — spectacle scenes decay; scenes with variable, participatory, or exploratory content hold pull longer because repeat visitors haven't exhausted the scene's attention surface.
Pattern 3: Dead rooms are predictable from corridor geometry, not from scene content. Three rooms in the production ran below their 10-viewer sightline minimum in more than half of the 60 performances. All three shared a common physical feature: they were accessible only through corridors with no competing audio signature. No bleed from adjacent scenes, no ambient sound, no performer pre-signal visible from the corridor mouth. Audience members, behaving like fluid under pressure, routed around these rooms without ever entering.
Color-coded movement heatmaps identify high-traffic hotspots across multiple events (Audience Heatmap, Rozie Synopsis) — the heatmap visualization made the dead room pattern immediately visible in a way the SM logs didn't: three rooms with near-zero activity surrounded by high-traffic corridors, forming a flow bypass that routed audience members around the entire northeast quadrant of the venue.
BLE and inertial sensors deliver sub-meter accuracy for anonymous movement tracking (Indoor Positioning Systems 2026, CrowdConnected) — the passive sensing infrastructure that would automate this data collection is available and affordable for productions at this scale. Manual SM logging worked for this 60-performance study, but at 120 performances across a longer run, automated tracking is the practical path.
PressurePath synthesized the 60-performance dataset into a revised flow model. The model treated the unintended garden corridor as a formal scene — assigning it a magnetic pull coefficient and a dwell time distribution — and recalibrated the confrontation scene's decay curve. The output was a revised call sheet for performances 61-90 that adjusted cue exit timing for the garden corridor (to release audience members before they accumulated past 35 bodies) and added a low-frequency audio signal to the three dead room corridors.
Multi-show longitudinal design studies synthesize lessons across years of performances (Immersive Storytelling Experiences Methodology, Tandfonline) — the 60-performance dataset sits at the medium-range end of this research frame: enough data to generalize about structural scene behavior, not enough to identify slow-decay or seasonal patterns. Productions running 120+ performances should plan for a second analysis pass. For productions with longer runs, comparison with 60,000 group runs of pacing leaks provides a high-volume reference for how structural patterns persist — and which intervention types actually correct them.
Scene Design Implications: What the Data Changes
The three patterns translate into design rules that the pre-show model didn't contain.
The 60-performance dataset also generated something more granular: a decay curve for the confrontation scene's magnetic pull, plotted by performance number. The scene averaged 22 viewers at performance 5, 19 at performance 20, 16 at performance 40, and stabilized at 15-17 from performance 45 onward. This decay is not random — it corresponds to the rising proportion of repeat-attenders in the audience. First-time visitors routed toward the confrontation scene at roughly the same rate throughout the run. Repeat visitors, having experienced it once, routed away from it at an increasing rate.
The implication for scene design is that high-spectacle scenes need to be designed for the mixed-audience composition a production develops over time, not just the first-timer audience that predominates in weeks one and two. A scene that's a draw at opening may be a dead room by month three if the production develops a strong repeat-attendance community and the scene lacks variable content. This is a design requirement, not a booking problem.
PressurePath's 60-performance analysis module generates this decay curve automatically and flags scenes whose trajectories suggest they will fall below sightline minimums before the end of the planned run. The output is a maintenance schedule: "Scene 7 is projected to fall below 20 viewers by performance 85. Introduce variable element or audio upgrade before performance 70." The director can plan the intervention in advance rather than scrambling when the problem becomes visible in SM logs.
Transitional spaces need acoustic intentionality. Every corridor, every landing, every between-scene space should be deliberately designed for either low-pull (no audio signature, low light, clear visual routing signal through to next scene) or defined-pull (specific audio signature, dwell target, integration with cue sheet timing). Unintentional pull from transitional spaces disrupts the intentional flow architecture.
High-spectacle magnet scenes need variable content to sustain pull across a multi-week run. Audience members who have attended 2-3 times, or who move fast through the show and revisit scenes, will reduce return visits to pure spectacle. Variable elements — performer improvisation windows, physical set elements that change, audience-participation components — extend the scene's attention surface and slow the decay curve.
Dead rooms are fixed by corridor design, not scene content. Adding more spectacle to a dead room doesn't solve the problem if the corridor approach provides no pre-signal. The intervention is in the approach, not in the room itself.
The connection to multi-act drift prediction models is that the 60-performance dataset validates and calibrates the drift coefficients those models use. Without empirical performance data, drift models use theoretical priors. With 60 performances of labeled data, the model updates its coefficients to match the actual show's behavioral patterns.
The 30-performance audit methodology for identifying dead rooms is the early-run version of this analysis — by performance 30, structural dead rooms are identifiable but not yet fully characterized. The 60-performance dataset completes the characterization and enables longitudinal comparisons.
The Show at Performance 60 Is a Different Show Than at Performance 1
Not because the script changed, but because you know where the audience goes. Productions that track this systematically make better decisions about what to adjust and what to leave alone. The water sounds in the garden corridor, once understood as a functional scene rather than an unintended bleed, could be designed into the production as a deliberate third-act transitional pause — a directorial choice rather than a drift problem.
Immersive theater companies currently in a long run and interested in synthesizing their performance data into a calibrated flow model are the audience this analysis was written for. PressurePath's production audit program builds a retrospective drift model from your existing SM logs and generates a prioritized intervention list for the current run. Contact the team for a production audit consultation.
The 60-performance study also surfaced a counterintuitive finding worth documenting explicitly: the dead rooms identified by corridor geometry analysis were not the same dead rooms the SM team had been flagging verbally. SM teams tend to notice rooms that are consistently empty and occasionally crowded — the high-variance rooms draw attention. The structurally dead rooms in this study were low-variance: they were consistently at 6-8 viewers, which is below the 10-viewer sightline minimum but doesn't feel like a crisis the way a 2-viewer performance does. Systematic dead rooms with stable low counts often escape SM attention precisely because they're not swinging wildly. The heatmap analysis caught them because it visualized the entire distribution, not just the outliers.
This has practical implications for any production using SM walkie-talkie reports as its primary quality signal: the SM team is calibrated to notice instability, not systematic underperformance. Productions that want to identify structural dead rooms need systematic data collection, not just verbal alerts. PressurePath's drift tracking module is designed specifically to surface the stable-but-underperforming scenes that verbal SM reports consistently miss. Immersive theater companies that have been running with SM logs alone and are curious what they're not seeing should apply for a data review session.