How to Audit Your Show's Dead Rooms Across 30 Performances
The Room That's Always Empty
Scene 11: the cellar. The director blocked it as a pivotal secondary space — a counter-narrative that enriches the production for viewers who discover it. In tech, it worked. But in performance, it is consistently empty. The cast member performing there plays to two or three viewers most nights, sometimes to none. The SM notes "thin cellar" in the running report after week two. By week five, the cast member is modifying their performance for low audience, and the director has not addressed it because there is no systematic evidence that it happens every night — just a series of "thin" annotations in individual show reports.
The cellar may be a genuinely invisible room — positioned in a corridor that most promenade paths skip, with no audio overspill to the main circulation routes and no partial actor visibility from any entry point. Or it may be positioned correctly but consistently undercut by a high-magnetism scene in the adjacent corridor that draws passing viewers before they notice the cellar entry. These are different problems with different solutions, and they cannot be distinguished without data. The SM's impression that the cellar "runs thin" identifies the symptom; a 30-performance audit identifies the cause.
This is the dead room problem as it actually presents in a running production: not a dramatic failure, but a quiet structural drain on the show's spatial narrative that accumulates invisibly in anecdote rather than data.
Research of Immersive Theatre (DRPress) establishes that comprehensive immersive theater evaluation requires documentation of room-by-room engagement — not just overall audience experience ratings or post-show survey data, but scene-specific occupancy patterns across the full run. Without that documentation, dead rooms are known impressionistically but cannot be diagnosed structurally.
Growth of Immersive Theater in LA (Haunting.net) documented longitudinal data on LA immersive shows showing recurrent audience clustering patterns — the same rooms crowd and the same rooms empty across productions, driven by venue geometry, scene placement, and audience circulation habits that persist across performer generations. The dead room in your cellar may be structurally predictable based on its position in the venue's circulation network.
The dead rooms spatial pacing primer covers the spatial mechanics of how dead rooms form; this post covers the audit methodology for identifying them systematically across a run.
The 30-Performance Audit Protocol
A dead room audit across 30 performances requires four data elements per performance: which scenes ran under 50% of their designed capacity, at which time points, what the corridor approach patterns were in the 10 minutes before the under-occupancy, and whether any adjacent scene was simultaneously overloaded.
Data collection. The minimum viable data set is a per-scene headcount at three fixed time points per act: T+8 minutes, T+22 minutes, and T+38 minutes, or whatever cadence fits your scene structure. Collected across 30 nights, this produces 90 data points per scene — enough to identify occupancy distributions with high confidence. Occupancy Sensors (Density.io) can automate this collection with per-room headcount logs persisted over the full run, removing the manual collection burden from running crews. Control and Being Controlled: Technology in Immersive Theatre (ResearchGate) documented technology-based audience tracking in immersive productions — sensor-based data collection is already in the immersive theater toolkit.
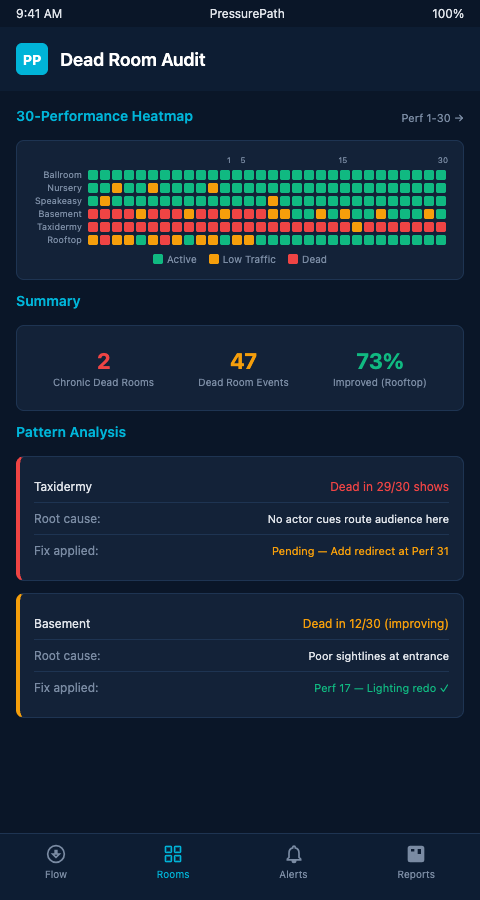
Pattern analysis. Once 30 nights of headcount data are aggregated, PressurePath's audit module identifies the dead room pattern: what percentage of nights each scene ran below 50% capacity, whether the under-occupancy concentrated in specific weekday/weekend or time-slot clusters, and which adjacent scenes were simultaneously at maximum. The cellar's dead room frequency may correlate with high occupancy in the adjacent library — which means the library's magnetic pull is the structural cause, and the cellar redesign question is really a library pressure-relief question.
Real Time Visual Crowd Analysis (PMC/NIH) establishes that density map estimation applied frame-by-frame to performance video enables post-hoc auditing when live sensor data is unavailable — video review at the three fixed time points provides equivalent occupancy data at higher labor cost.
How Museums Use Data (Mapsted) describes museum foot-traffic methodology that transfers directly to dead-room auditing: per-zone dwell time, traffic path analysis, and under-visited exhibit identification are the museum equivalents of the immersive theater dead room audit. Museums act on this data with exhibit redesign and docent repositioning; immersive productions can act on it with blocking revision and scene redesign.
Advanced Tactics: Acting on Audit Findings Without Mid-Run Disruption
The challenge with dead room findings mid-run is that structural corrections require rehearsal time that may not be available. A dead room caused by poor corridor geometry cannot be fixed by a blocking note. A dead room caused by the adjacent library's magnetic pull requires a counter-attraction intervention. A dead room caused by inadequate audience awareness that the scene exists requires a signaling or routing redesign.
Each cause requires a different intervention category, and audit data reveals which cause applies. The 60 performances drift data analysis provides a longer-horizon view of the same patterns — some dead rooms stabilize over a long run as audiences acclimate to the production's spatial logic; others compound.
Routing interventions — modifying the usher's corridor guidance to direct a proportion of viewers toward the dead room — are the lowest rehearsal cost option and can be implemented without cast or crew changes. They require a PressurePath-calibrated estimate of how many additional viewers the routing change will generate per night, to confirm the scene will reach viable occupancy without overcrowding.
Signaling interventions — adding a partial visibility element, audio overspill, or light quality visible from the corridor approach — require minor staging modifications but no blocking revision. These are appropriate when the dead room's cause is audience ignorance of the scene's existence rather than audience preference for an adjacent scene.
Blocking revisions require rehearsal time and carry the highest disruption cost. They are appropriate when the dead room is caused by the scene's spatial position or narrative content rather than by routing and signaling factors. Audit data that shows the cellar running under 50% occupancy on 24 of 30 nights, with no correlation to adjacent scene pressure, points toward a blocking or content cause that only revision can address.
One underused application of dead room audit data is actor performance calibration. An actor in a dead room who has been performing at low audience for weeks has adapted their technique — quieter delivery, smaller physical scale, less audience engagement — in ways that may persist even after routing and signaling interventions bring headcounts back to designed levels. The audit report that shows the cellar running at low occupancy for 24 nights should include a note to the director about performance recalibration alongside the routing and signaling recommendations.
Dead room audits also reveal a pattern that is rarely visible from night-by-night observation: some dead rooms are dead at specific time points but adequately occupied at others. A scene that runs below 50% occupancy during the Act 1 window between minutes 15 and 25 but at designed capacity between minutes 35 and 50 is not a dead room — it is a timing problem. The audience is reaching the scene outside the optimal circulation window. Audit data broken down by time point identifies whether the intervention is routing (getting viewers to the scene earlier in their promenade) or capacity (the scene needs to be designed for the actual arrival window, not the theoretical one).
The photo op audit methodology from escape room operations applies a comparable multi-session audit framework to identify structural flow problems — the cross-domain parallel confirms that the 30-performance audit approach generalizes across venue types. Diverse and Discerning: Immersive Audiences (Birmingham) establishes that multi-show survey data identifies systemic patterns — the audit protocol described here provides the operational data layer beneath the audience survey findings.
Start the Audit Data Collection on Night One
Retrospective audits — attempting to analyze 30 nights of performances using anecdotal notes and SM memory — produce impressions, not data. The 30-performance audit requires structured data collection from the first night. Productions that implement the data collection workflow during tech and collect it consistently from the first preview will have complete audit data by the end of the first month.
The first-night implementation sequence has three steps. First, define the data collection protocol during tech: which scenes are audited, at which time points, by which crew member, using which format. This protocol should be documented as a single-page addendum to the running script so the SM team can reference it without consulting a separate document. Second, pilot the protocol during the first dry tech to confirm the crew member assigned to collection can reach their observation position without disrupting the scene — a protocol that requires an usher to walk across a scene room during performance is not viable. Third, rehearse the collection workflow during the first dress rehearsal, treating the dress as a full data collection run. By the time the first preview opens, the protocol has been validated and the crew has built the muscle memory needed to execute it consistently.
The cost of beginning data collection on night one is essentially zero — the crew is already on position, the SM is already tracking the show — but the cost of attempting to reconstruct 30 nights of data from memory at week four is significant. The time arbitrage is massive: five minutes of protocol definition during tech produces 30 nights of structured audit data. Five weeks of retroactive reconstruction produces a best-guess approximation that cannot support confident structural decisions.
Immersive theater directors and producers managing multi-scene productions across a full run need dead room data that identifies structural causes, not just symptoms, early enough to act before the run ends. Join the PressurePath waitlist for 30-performance dead room audit tools built for immersive venue spatial analysis.