Economics of Audience Capacity in Site-Specific Theater
The Capacity Decision That Determines Whether You Recoup
At 100 audience members, the show works. At 180, the critical Act 2 scene becomes a sardine experience and three consecutive reviewers describe the production as "claustrophobic." At 60, the venue feels abandoned and ticket revenue falls below the weekly operating nut. Somewhere in that range is the optimal capacity window — and almost no site-specific production has a quantified model for where it is.
The Economics of Immersive (WXO) documented Sleep No More grossing $10M+ annually — but that gross depended on a capacity strategy refined through years of running. Productions at that scale can absorb years of trial and error. Most productions cannot. The immersive theater market hit $20.66B in 2024, growing at 26.9% CAGR through 2030 (Grand View Research), which means new productions are entering a market that rewards getting this right quickly rather than learning it across a multi-year run.
Traditional grant and donation models are insufficient for immersive theater; admission models break down at small audience sizes (Cornell ILR) — this structural constraint means most productions are running on ticket revenue alone, which makes the capacity decision a financial survival question, not an artistic preference. The scaling decisions at 400 members show where the capacity curve gets structurally dangerous at the high end.
The Revenue-Flow Model: Connecting Capacity to Experience Quality
Site-specific venues impose hard constraints that conventional theater venues don't. Site-specific venues lack infrastructure; capacity constraints emerge from architecture (Wikipedia) — the corridor is only so wide, the room is only so large, and neither the director's vision nor the box office manager's spreadsheet can change those physical facts.
The revenue-flow model starts from these physical constraints and works outward. Each scene room has a sightline ceiling — the maximum head count above which blocking arc integrity degrades. This is a function of room geometry, set placement, and the director's spatial blocking, not an arbitrary number. If the Library scene requires 20 sightlines to function as designed but holds a maximum comfortable capacity of 35, the operational range is 20-35. Below 20, the scene underperforms. Above 35, the experience degrades.
The pressurized-water-in-pipes model maps the full venue as a flow network: audience members move between scene rooms like fluid through connected pipes, with each room having both a minimum pressure level (the sightline floor) and a maximum pressure level (the density ceiling). The economics question then becomes: what total capacity maximizes revenue while keeping every room in the operational range simultaneously?
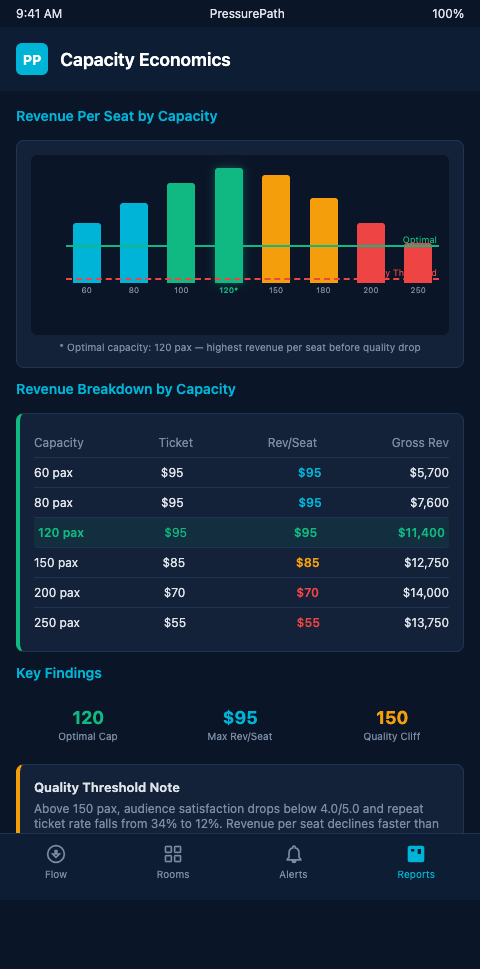
PressurePath simulates this by running expected flow distributions across a range of total capacity inputs. The simulation identifies the capacity window where the probability of all rooms operating within their sightline ranges simultaneously exceeds a threshold — typically 80% of performance time. Below the window, too many rooms run empty. Above it, too many rooms exceed their density ceilings.
Analytics-based seat allocation yields 2-3% revenue enhancement (Dynamic Capacity Allocation, ScienceDirect) — in live entertainment, that percentage gain compounds across hundreds of performances. For a production selling 150 tickets at $75, the difference between 145 and 150 sold seats per show is $375 per performance, or $46,500 over a 124-performance run. But the flow-based constraint is the prior question: is 150 inside the operational window where all scenes function, or does it push two rooms past their density ceilings and erode the experience that justifies the $75 ticket?
Dynamic pricing based on occupancy and demand is growing rapidly in live entertainment (Smart Pricer) — for immersive theater, dynamic pricing is a useful tool only after the capacity window is established. Pricing at 120% of optimal capacity to capture peak-demand revenue destroys the experience that generates word-of-mouth for the next booking cohort.
Tactical Capacity Levers: What You Can Actually Adjust
Once the optimal capacity window is modeled, productions have three categories of levers to maximize revenue within it.
A foundational point before the tactics: the capacity window is venue-specific and show-specific, but the modeling logic is generalizable. Productions that have run the model on their venue and their current show architecture can then test architectural modifications — adding a corridor baffle, extending a transitional scene, re-sequencing the act structure — against the revenue impact. The simulation quantifies the trade: removing a corridor baffle gains 12 additional tickets per show and costs approximately 15% degradation in the critical Act 2 sightline score. The producer makes the decision with the trade-off quantified rather than guessed.
This is where the economics and the artistry intersect in a way that most production conversations avoid. Producers often treat the director's blocking requirements as fixed and the ticket count as the variable. Directors often treat the ticket count as fixed and the blocking as the variable. The revenue-flow model makes both movable and shows exactly what changing each costs.
Ticket tier differentiation by time-of-entry: audiences entering at offset intervals generate lower peak corridor pressure than a single house open. A show that allows 150 total bodies can stagger entry in three batches of 50, which the simulation shows distributes initial scene populations more evenly than a single mass entry. Revenue per performance stays the same; experience consistency improves.
Scene-time extension for peak-demand nights: if the model shows that a particular night's ticket batch — large groups, advance buyers, high repeat-attendance probability — skews toward magnet scenes, extending the runtime of secondary scenes by 8-10 minutes creates additional capacity absorption in underused rooms. PressurePath generates specific extension recommendations based on forecast flow distribution.
Physical corridor adjustments between venue configurations: pay-what-you-want and variable pricing analysis (Yale Drama) shows that perceived value tracks experience quality closely. Narrowing one corridor to reduce north-wing overflow actually allows producers to raise ticket prices because the experience becomes more reliably intimate — and the simulation can test whether that narrowing creates unacceptable throughput delays at scene transitions.
High-end extensions of this capacity model show that the economics compress at scale: the cost of getting the capacity window wrong grows with every additional body, and the simulation's value compounds accordingly.
Cross-format comparison with museum exhibit investment economics shows the same revenue-per-experience-unit problem in a different context: exhibit designers who don't model optimal throughput leave revenue on the table through both undercrowding and overcrowding, and the correction methodology runs parallel to immersive theater capacity optimization.
The touring flow standards post addresses the venue-variation problem that makes capacity modeling non-transferable across sites — each venue requires its own model because the physical constraints differ.
Build the Model Before Pricing the Tickets
The capacity decision in site-specific theater is effectively a pricing decision. The number you put on the booking page determines not just revenue but experience quality, word-of-mouth trajectory, and long-run recoupment probability. PressurePath models this explicitly, treating optimal capacity as a flow problem rather than a box office guess.
A practical consideration for productions that have already committed to a capacity number: the model remains valuable even post-commitment. If the current capacity is above the optimal window, the simulation identifies the specific scenes under pressure and generates targeted interventions — set adjustments, cue timing changes, corridor modifications — that expand the effective window upward without requiring a reduction in ticket sales. Some productions find that a $2,000 set modification unlocks an additional 20 tickets per performance across a 100-performance run. That's $40,000 in additional revenue against a $2,000 cost. The flow model surfaces that trade explicitly.
For new productions, the model should inform the pre-production budget: if the simulation shows that your target capacity requires specific corridor infrastructure — lighting, audio distribution, baffle placement — those requirements belong in the production budget rather than the mid-run repair budget. Flow infrastructure built into the design is cheaper and more effective than flow infrastructure retrofitted into a running show.
The recoupment timeline in immersive theater is unusually sensitive to this because productions carry high fixed costs — venue rent, cast size, set complexity — against a revenue stream that depends entirely on tickets. A production that misprices capacity by 15-20% in either direction runs on a materially longer recoupment timeline or never recoups at all. The simulation replaces the box office manager's rule of thumb with a quantified projection tied directly to the venue's physical reality.
Producers and artistic directors making capacity decisions for upcoming runs or for scaling existing productions are the exact practitioners this analysis was written for. Join the waitlist for PressurePath's immersive theater access tier and receive a capacity model built on your venue geometry before your next ticket batch goes on sale.
The capacity model also creates a common language between artistic teams and producing teams. Directors think in terms of sightline targets and blocking integrity; producers think in terms of revenue per seat and weekly operating costs. These two languages rarely meet in a shared document. The capacity model creates that shared document: a simulation output that shows, in terms both parties can use, what different capacity choices cost in both experience quality and revenue. A director who sees that her sightline minimum requires no more than 130 audience members, and a producer who sees that 130 generates $12,000 less per week than 155, are now having a productive negotiation about whether a set modification exists that expands the window — rather than talking past each other in their respective vocabularies.
This collaborative framing is one of the less-discussed benefits of flow modeling for site-specific theater. The model doesn't just solve the technical problem. It structures the conversation between the people who need to solve it together.