Reading Tropical Depression Tracks for Grove-Specific Harvest Pull-Forward
Depressions Are the Actionable Stage, Not the Watch Stage
The NHC glossary lays out the operational definitions: tropical depression is the pre-named stage where winds stay below 34 knots, and intensity forecasting starts well before the named-storm stage (NHC Glossary of Terms). An MDPI review on operational forecasting of tropical cyclone rapid intensification documented that RI cases made up roughly 10% of 2025 forecasts, and depressions can leap categories pre-landfall (MDPI: Operational Forecasting TC Rapid Intensification NHC). That number is the core reason coastal groves need a depression-track reading practice — by the time a system is upgraded to named status, the harvest-pull-forward decision may already be behind schedule.
Wind effects at the tree level are not subtle. A New Phytologist study on wind intensity and tree hydraulic dysfunction during a hurricane documented 15% hydraulic loss even under tropical storm winds, with pre-landfall pull-forward meaningfully preserving medium-term tree health (New Phytologist: Wind intensity tree hydraulic dysfunction hurricane). Citrus Industry's reporting on Hurricane Milton's spotty citrus damage captured the category-sensitivity: category 3 winds brought near 100% fruit drop while category 1 winds left much lower loss (Citrus Industry: Hurricane Milton Spotty Citrus Damage). Track accuracy determines pull-forward value.
The decision window shrinks as the system approaches. A tropical depression 96 hours out gives the grove many options — pull forward, stage crews, arrange packinghouse slots, pre-position equipment. At 48 hours out the options narrow — crews may already be booked for other blocks, packinghouse slots may be committed, and extended pull-forward options close. At 24 hours out the grove is executing whatever plan was set at 48 hours. Captains who already understand the hurricane forecast limits of the NHC product know that the 36-hour warning is sized for evacuation, not for packinghouse logistics. The practical consequence: depression-stage reading isn't optional planning hygiene; it's the only window where the decision space is actually open.
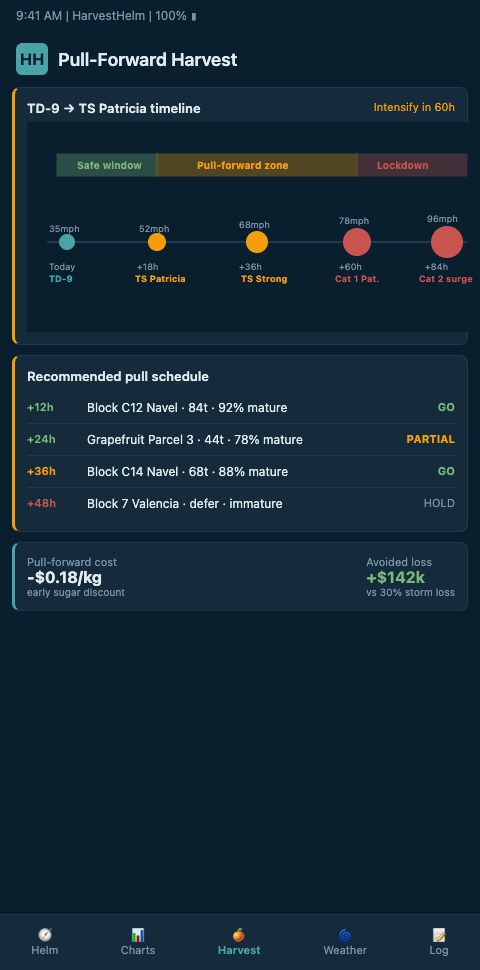
Reading Depression Tracks on the Helm-Charted Yield Forecast
HarvestHelm frames depression-track reading as an early-instrument check on the yacht navigation dashboard. The helm-charted yield forecast starts pulling NHC Graphical Tropical Weather Outlook products at the 2-day and 7-day stages (NHC Atlantic Graphical Tropical Weather Outlook) and projects per-block pull-forward consequences for each candidate intensification scenario. The captain sees three possible tracks rendered on the chart, with a confidence-weighted intensity curve for each — and can see which blocks' pull-forward decisions are sensitive to the intensity question versus which are sensitive to the track question.
A ScienceDirect review of pre-landfall intensity, track, and structure forecasting advances supplies the forecast skill baseline (ScienceDirect: Advances TC Track Intensity Structure at Landfall). HarvestHelm layers that baseline against block-level maturity, packinghouse throughput, and crew availability so the captain reads the dashboard as a composite — storm evolution plus operational state.
The decision math is explicit. UF/IFAS CREC's reminder that citrus does not ripen after picking anchors the pull-forward calculation (UF/IFAS CREC Picking Fruit) — fruit pulled 10 days early locks in the brix and size-curve state at that moment, with premium-tier consequences. HarvestHelm computes the expected revenue for each block under three scenarios: stay and harvest at maturity, pull forward 48 hours, pull forward 96 hours. The helm chart shows all three next to each other, per block, so the captain picks the best play.
USDA FSA's pre-Idalia producer guidance supplies the logistics frame — pre-storm harvest and logistics decisions that feed indemnity documentation (USDA FSA Florida Hurricane Idalia Preparation). HarvestHelm translates those checklist items into dashboard actions so documentation is captured as the pull-forward executes.
A specific pull-forward calculation illustrates the chart's value. For a Hamlin block 72 hours from expected landfall under an outer-cone TS scenario, the "stay and harvest at maturity" play prices higher than pull-forward by roughly 8% on a per-carton basis — sizing completes and brix climbs during those extra 10 days. Under the inner-cone Cat 1 scenario, the "pull forward 96 hours" play prices higher because the alternative is 30% fruit drop at landfall. Under the RI variant, the "pull forward 48 hours" play prices highest because the logistic constraint of packinghouse throughput becomes binding. Three scenarios, three plays, each with a priced outcome — the captain picks the play weighted by scenario probability.
The math gets sharper as the system evolves. Monday afternoon, the depression has organized and the NHC has upgraded the outlook from 40% to 70% probability of tropical storm formation. HarvestHelm re-weights the three scenarios: inner-cone Cat 1 probability climbs, outer-cone TS probability drops, RI variant probability holds steady. The recommended play shifts — what was a 40/40/20 scenario mix becomes 55/25/20, and the pull-forward decision for blocks 3 and 7 moves from "maybe" to "yes" under the updated weights. The captain doesn't rerun the analysis by hand; the chart updates and the recommendation follows the probability shift automatically.
Depression tracks also test your grove's documentation discipline. Pull-forward decisions driven by a depression-stage read need to be captured in a way that defends the decision against post-event review — by insurance adjusters, by FDACS block-grant administrators, or by internal audit. HarvestHelm's decision log captures the probability weighting at the time of the decision, the NHC product that drove the weighting, and the block-level action that followed. When the decision is reviewed later, the chart shows exactly what the forecast looked like at decision time and why the action was rational — even if the actual outcome differed from the central expectation. That documentation discipline is increasingly what separates defensible proactive risk management from reactive post-event storytelling.
Advanced Tactics: Reconciling Depression Signals With Grove-Level Instruments
The classical pitfall is treating the 2-day depression outlook as noise. That treatment works only in a world where depressions rarely intensify — a world the 2025 RI numbers say we don't live in. HarvestHelm's depression-stage ingestion keeps the dashboard reading at advisory cadence and trigger-alerts as the system crosses watch and warning thresholds.
A second tactic is pairing the depression read with the limits of the 36-hour cone. The 36-hour forecast has structural gaps; the 2-day outlook has its own gaps. Running both in parallel gives you earlier resolution on when the pull-forward decision needs to execute.
Third, a depression read drives category 2 early harvest planning. If the depression has a non-trivial probability of crossing to Cat 2, the pull-forward logic shifts from selective to blanket, and packinghouse dispatch has to scale. The helm chart flags the Cat 2 crossover point as a distinct chart-line — the captain sees the category 2 gate before the system hits it.
Cross-niche, monsoon-driven monsoon harvest pull-forward decisions in tropical mango share the same logic: pre-event intensification read triggering selective pull-forward. Mango and citrus are different crops; the decision architecture transfers. Common grower errors:
- Waiting for the system to be named before mobilizing crews.
- Pulling forward in lockstep across the grove rather than block-by-block.
- Ignoring RI probability because the current intensity is modest.
- Not reconciling depression outlook with local wind instruments.
- Treating the 2-day outlook as a low-probability event and not staging any response.
- Failing to price the packinghouse throughput constraint into the pull-forward decision — the binding constraint is often dispatch capacity, not picking capacity.
Multi-grove operators face one more layer: coordinating pull-forward decisions across groves that share crews and packinghouse access. A depression with asymmetric inland-versus-coastal exposure can trigger pull-forward at one grove while another grove continues normal operations — and the crew and packinghouse resources need to shift accordingly. HarvestHelm handles this as a linked-groves view so the captain can see pull-forward demand across all parcels against total available resources and resolve conflicts at the chart rather than at the point of execution.
Pre-season scenario-running sharpens in-season decision quality. HarvestHelm's depression-track playbook walks through three historic depression tracks — Ian 2022, Idalia 2023, Milton 2024 — and shows how each grove's pull-forward decisions would have scored against actual outcomes. The exercise builds the captain's confidence in reading the chart and surfaces calibration issues before the season turns active. Growers who run this tabletop in June typically make their first in-season pull-forward decision faster and with less second-guessing than growers who skip the pre-season run. Confidence at the chart is the difference between acting at 72 hours and acting at 36.
Insurance alignment is the final layer. Depression-track reading that drives documented pull-forward decisions generates the record of proactive risk management that underwriters reward in parametric-insurance pricing. A grove that can show consistent depression-stage decision-making across multiple seasons argues for favorable terms on sensor-trigger parametric products, because the grove is actively reducing its own loss exposure rather than passively waiting for events. The helm chart's decision log is structured to support the underwriting conversation, which is increasingly part of the commercial story for coastal citrus operations. Growers who think about their decision chart as an insurance instrument as much as an operational one are positioning themselves for the next generation of coastal-agriculture risk pricing — and the HarvestHelm architecture serves both audiences from the same data layer.
Get Early Access to the Coastal Citrus Grove Dashboard
Florida, Gulf Coast, and Atlantic-ridge citrus operations that have lost brix and premium-tier pricing to late pull-forward decisions are onboarding HarvestHelm for the next Atlantic season. The helm-charted forecast plugs NHC depression products into block-level pull-forward math so your 96-hour decisions are priced before the 36-hour warning drops. Join the Coastal Citrus Grove waitlist with your block list, last-season pull-forward timeline, and packinghouse capacity — we'll calibrate the depression read to your grove. Operations joining the May cohort get their pre-season tabletop run against three historic depression tracks — Ian 2022, Idalia 2023, Milton 2024 — with each grove's pull-forward decisions scored against actual outcomes before the first 2-day outlook of the season lands.
Day one of the dashboard shows three-track pricing per block: stay-and-harvest-at-maturity, pull-forward-48-hours, and pull-forward-96-hours, each priced in expected revenue with probability weights updating as the NHC outlook climbs from 40% to 70% formation probability. Multi-grove operations with shared H-2A crews and packinghouse access see the linked-groves view that resolves crew-and-dispatch conflicts at the chart rather than at the point of execution. Growers sharing their last-season decision log see the probability-weighting framework calibrated to their actual lead-time discipline, with decision-log timestamps structured to support parametric-insurance underwriting conversations and defend pull-forward calls against FDACS block-grant review after the storm passes.