Why 36-Hour Hurricane Forecasts Fail Grove-Level Harvest Decisions
The 36-Hour Cone Is Not a Grove-Level Planning Tool
On October 9, 2024, Hurricane Milton's 36-hour cone shifted more than 40 miles between advisories, catching late-season Florida citrus growers with fruit still on the tree (Citrus Industry: Florida Citrus Perfect Storm). The NHC's own cone documentation is explicit about the math: the cone radius is sized so the historical center position lies inside the cone only two-thirds of the time (NHC Definition of the Track Forecast Cone). Verification data from the 2024 NHC Verification Report Preview quantifies track and intensity error by lead time, and the 36-hour numbers have flattened — not because forecasts got worse, but because residual error is hard to squeeze out (2024 NHC Verification Report Preview).
Layer on rapid intensification — which an MDPI review characterized as notoriously difficult with high false-alarm rates through 2015 and beyond (MDPI: Operational Forecasting Tropical Cyclone Rapid Intensification) — and the 36-hour product becomes structurally hostile to grove-level planning. The NWS itself sets hurricane warnings at 36 hours before TS-force winds (NWS Hurricane Watch Warning Lead Time), but that window is when the forecaster is most uncertain about intensity change.
For a coastal grove running packinghouse contracts on tight size-curve specs, each hour of uncertainty translates to real decisions that can't be revisited. A crew booked to arrive at 6 a.m. tomorrow cannot be redirected at 2 a.m. based on an advisory shift. A packinghouse dispatch queue set 48 hours out can't be resequenced on a 12-hour notice without losing throughput. The 36-hour forecast is sized for public safety lead times, not for agricultural logistics that need decisions locked 60-72 hours out.
Building a Helm-Charted Yield Forecast That Runs Ahead of the Cone
HarvestHelm's design principle is that grove-level decisions need grove-level signals, not regional forecasts. The helm-charted yield forecast takes the NHC product as one of many inputs — not the backbone. The yacht navigation metaphor is the mental model: when a captain steers the yacht helm through changing conditions, they don't wait for the regional forecast to confirm what the barometer and the sea state are already showing. The captain reads their instruments first.
For coastal citrus, the equivalent instruments are:
- Sub-regional pressure trends — 500 mb pattern shifts pulled into the block-level salt risk model hours ahead of the NHC advisory cycle.
- Local wind vector changes — the onset of sustained onshore winds at the grove matters more than the track of the storm center.
- Soil EC trajectories — as storm-driven salt aerosol lands, EC climbs; a fast climb is a reason to pull the harvest forward even if the track hasn't moved.
- Packinghouse capacity state — downstream throughput ceilings set the ceiling on pull-forward decisions.
The NHC's verification page publishes the 5-year error statistics that HarvestHelm bakes into its confidence bands (NHC Forecast Verification), and the intensity predictability review from NOAA AOML documents the specific mechanisms that make 36-hour intensity calls unreliable (NOAA AOML: Determining Uncertainty Hurricane Intensity). HarvestHelm doesn't pretend to out-forecast the NHC — it re-frames the cone as a probability field and projects per-block harvest consequences under each outcome.
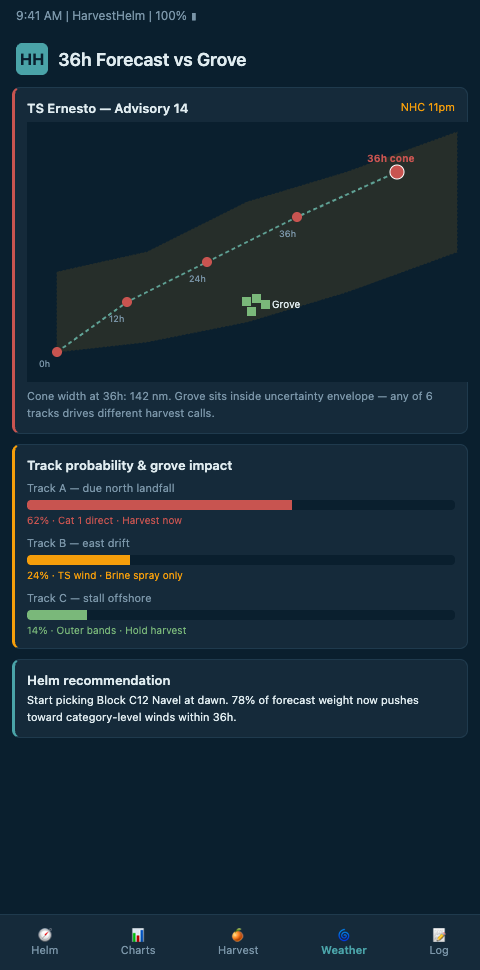
The dashboard shows the captain — you, the grower — three tracks: inner-cone landfall, outer-cone landfall, and rapid-intensification variant. Each track drives a different harvest pull-forward decision, different evacuation priorities, different packinghouse dispatch. One glance gives you the three plays, the confidence level for each, and the block-level yield swing under each scenario.
A practical example. Sunday morning, 72 hours before expected landfall, the NHC cone puts the center 120 miles offshore with a Cat 1 intensity. HarvestHelm reads three tracks: inner-cone (direct hit, Cat 1), outer-cone (grazing miss, TS winds), and RI variant (Cat 2 or higher). For a Murcott block targeting 80-count premium cartons, the inner-cone track says pull forward now and accept the size hit; the outer-cone track says hold and let sizing complete; the RI variant says pull forward hard across all blocks because packinghouse throughput will be the binding constraint.
Groves that have already calibrated their tropical depression tracks playbook will have seen the 70-to-96-hour decision framing well before Sunday morning. The captain sees three different plays, priced against expected revenue per play, and can make a decision before the 36-hour warning drops. Without this framing, the decision is still being made in the 12-18 hour window where logistics have already frozen.
The historical-error calibration makes the three-track view honest. HarvestHelm uses the five-year NHC verification data as the base probability distribution for track error, and overlays the current season's ensemble spread as a conditioning factor. When ensemble agreement is tight, the three tracks converge and the captain's decision is easier. When ensemble disagreement is wide, the three tracks diverge and the chart prioritizes decisions that are robust across all three — typically the pull-forward and the crew-prestage moves that don't penalize any single scenario. The chart surfaces the difference between high-confidence and low-confidence forecasts, rather than collapse them into a single point estimate.
Advanced Tactics: Reading Tropical Depression Stages and Edge Cases
The edge case that catches growers worst is the pre-named system. A tropical depression that has not yet been upgraded to a tropical storm still gets advisories, but NHC 36-hour cone geometry is wider and the intensity forecast carries more uncertainty. The right response is to start the decision tree earlier, not to wait for a named storm. Grove operators who run the depression-stage decision tree before a name ever lands tend to finish their pull-forward packhouse reservations 48 hours ahead of growers who wait.
A second trap is treating the NHC advisory as the end state of your sensor logic. NHC issues on a fixed 6-hour cycle; pressure and wind fields change continuously. HarvestHelm's NHC advisory sensors integration ingests ground-truth at 5-minute resolution and reconciles it against the last NHC bulletin — so when the helm chart shows conditions deviating from the advisory, you see it before the next cycle drops.
The same pattern of regional forecasts missing canopy-scale events applies in tropical mango geography. The cross-niche parallel — regional canopy-fungal gaps — reinforces why grove dashboards need local sensors, not only regional models. Common failure modes growers report:
- Treating the cone center as the most likely outcome when it's actually the most likely single point but still below 50% probability.
- Relying on the 36-hour warning as the trigger to mobilize crews — 48-hour watch-level signals were already in the data.
- Pulling forward based on track alone without weighting intensity uncertainty.
- Treating regional forecast products as the ground truth when grove-level sensors are showing wind or pressure divergence.
- Failing to couple packinghouse throughput constraints into the pull-forward decision — which leads to excess pick that can't be dispatched and rots in bins.
Scaling the helm-chart approach to multi-grove operations requires one more discipline: per-grove calibration of the three-track projection. A grove 30 miles inland of one further coastal grove will see the same storm evolution differently, and the pull-forward decisions will diverge. HarvestHelm treats each grove as its own helm chart — the captain can compare side by side but doesn't get a single grove-averaged recommendation that hides the heterogeneity. Growers with operations in multiple coastal counties report this as the single feature that most changes their season — the end of treating the NHC cone as one gauge for all parcels.
Integration with historical insurance and disaster relief documentation closes the loop. A forecast-based pull-forward that's documented in the helm chart generates the timestamp and block-level records that FDACS block-grant and FSA indemnity programs require. Growers who execute pull-forward decisions through HarvestHelm produce the documentation as a byproduct of the decision rather than reconstructing it after the fact. The difference, in payout timing, can be months; in payout accuracy, can be meaningful percentage points. The helm chart isn't only a forecast tool — it's the documentation layer that makes post-storm economics defensible.
The broader point: 36-hour forecasting is a public-safety product, not an agricultural-operations product. The NHC is not at fault — the forecast is optimized for evacuating people, not for dispatching packinghouse slots. Coastal growers who keep trying to make the 36-hour forecast into a grove-operations instrument will keep losing premium-tier revenue to late decisions. The right move is to treat the NHC cone as one input among many, layer it against block-level sensors and probability-weighted track scenarios, and execute decisions at 72-hour and 96-hour lead times where the logistics space is actually open. That reframing is what HarvestHelm's helm-charted yield forecast is built to deliver, and it's what separates grove operations that thrive in active seasons from operations that survive them.
Get Early Access to the Coastal Citrus Grove Dashboard
Coastal Valencia and Hamlin growers running packinghouse contracts and juice-plant deliveries are signing onto the HarvestHelm beta now. If a 36-hour forecast miss means your 80-count cartons get downgraded to juice or your Murcott blocks miss the premium-tier window, the helm-charted forecast is built for you. Join the Coastal Citrus Grove waitlist and we'll schedule your first season walk. Tell us your block count, cultivar mix, and nearest NWS coastal station — we'll stand up your helm chart ahead of Atlantic season.
Pre-season cohorts joining by mid-May get the three-track projection calibrated against the last five years of NHC verification data before the first depression reaches the Caribbean, with inner-cone, outer-cone, and rapid-intensification scenarios priced per block in expected revenue. Day one of the dashboard shows your 96-hour pull-forward decision frame — crew staging, packinghouse throughput ceiling, and FDACS block-grant documentation timestamps captured as the decision executes. Growers with mixed Valencia and Murcott blocks see ensemble spread conditioning applied per block, so the tight-ensemble calls firm up before logistics freeze at 12-18 hours out. Send your packinghouse dispatch cadence and we will lock the 72-hour and 96-hour decision windows to your actual operational lead time rather than the public-safety advisory clock.