Dashboard Workflows During Active Haboob Warning Windows
The 38-Minute Window You Cannot Multi-Tab
When a haboob enters the forecast, a grove supervisor's workflow typically touches multiple data sources: the NWS bulletin page, a regional dust-model overlay, a satellite imagery site, the grove's own wind-sensor dashboard, the crew mobile app, and the packing shed's intake scheduler. NWS's dust storm page defines the warning criteria, and NOAA NESDIS coverage of the haboob tube via GOES-West shows the near-real-time imagery feeds. The NWS Phoenix August 25 2025 report reconstructs the event timeline: satellite signature, radar front, visibility collapse, shelter-order timing. Every minute spent multi-tabbing is a minute not spent making the right call.
Real-time haboob monitoring has matured fast. Copernicus's Saharan dust tracking forecasts deliver 12-hourly AOD forecast data suitable for dashboard overlays. WMO's Barcelona Dust Regional Center runs an operational dust forecast model ensemble supporting MENA dashboards. NWS Phoenix's radar-based dust storm characteristics describes Doppler radar signatures that feed real-time haboob identification. The data exists; the missing piece is operational integration into a single console that a supervisor can act on in 90 seconds.
Date grove supervisors managing Medjool and Barhi harvest crews during khalal-to-rutab transitions face an additional constraint that no general-purpose dashboard addresses: ladder-deployed palmeros cannot abandon a half-picked bunch and descend in the same time a ground-crew worker needs to move to shelter. The 38-minute window that collapses visibility at Sky Harbor becomes an even shorter window at the crown level of a 12-meter Deglet Noor palm where a partially filled mesh bag, a rope-lower basket, and a narrow ladder all need to be secured before descent. Cooperative managers coordinating cross-parcel response across Zahidi and Barhi blocks multiply this constraint by every active palmero on site.
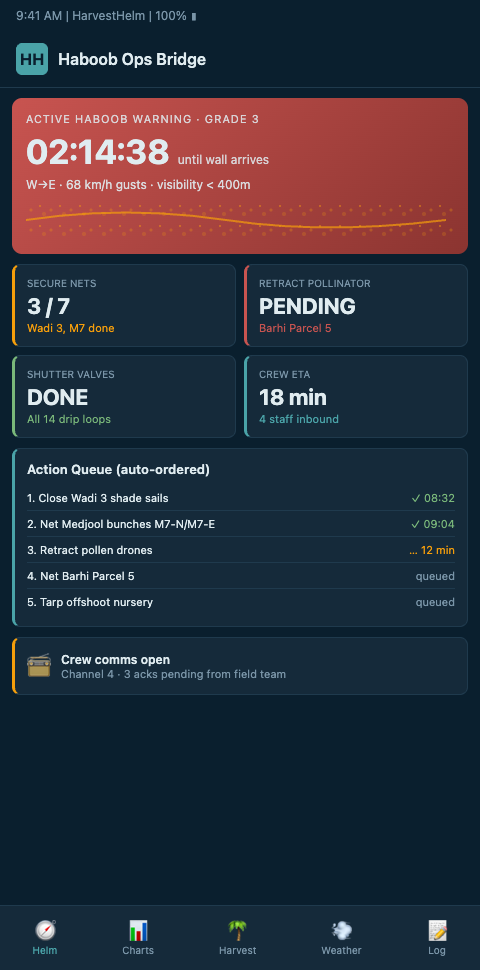
A Helm-Charted Yield Forecast That Becomes a Storm Bridge
When a haboob warning window opens, HarvestHelm's dashboard transitions to storm-bridge mode. The normal helm-charted yield forecast — harvest planning, pollination schedule, irrigation triggers — slides to a secondary panel, and the storm console takes the primary view. This is the yacht-navigation analogy at its most direct: in heavy weather, the captain is on the bridge watching the instruments; the cruising charts are still available but not what the captain is looking at.
The storm bridge runs four panels. The first is the front-position map. GOES ABI satellite imagery layers onto the grove map with 5-minute refresh, overlaid with the regional Doppler radar Z-field showing dust-front leading edge. AZ Emergency Information Network's dust storm playbook provides the state-level operational pattern that HarvestHelm replicates in the dashboard. The captain sees the front location, heading, and speed — the same way a yacht bridge shows a squall line on radar — and the console draws projected arrival times across the grove at 5-minute intervals.
The projection includes uncertainty bands so the captain sees the 80th-percentile arrival time as well as the 50th-percentile median estimate. Fronts rarely move at constant speed; acceleration and deceleration patterns depend on surface roughness, inversion strength, and wadi-funnel geometry. The dashboard's arrival cone widens or narrows as confidence changes, and the captain calibrates the shelter-order timing against the earliest plausible arrival rather than the expected arrival. This is the difference between a safe evacuation and a race-against-the-front evacuation, and the cone-based display is how the yacht-bridge metaphor carries forward into storm response.
The second panel is the local sensor stack. Every wadi-level and grove-perimeter sensor reports visibility, wind speed, wind gust, and PM10 dust density at 1-minute cadence. The dashboard arranges the sensors spatially to match the grove map, so a visibility drop on the west perimeter shows up visually as a color shift on the left side of the map. Confirmed arrival is when any two adjacent sensors cross the action threshold within 4 minutes of each other — the helm fires a confirmed-arrival event and advances to the next response stage automatically.
The two-sensor confirmation rule eliminates false triggers from single-sensor dust events like vehicle passes or equipment operation near a sensor. Raising the threshold to two adjacent sensors crossing within a tight time window means the helm reacts to genuine front arrivals while ignoring isolated spikes. This is the same hysteresis principle yacht radars use to filter wave returns from actual targets: the reading has to persist across multiple returns before the system declares a contact. Operations running single-sensor triggers report 15-25% false-alarm rates; two-sensor confirmation brings that under 3% while only delaying real-front detection by 60-90 seconds.
The third panel is the crew and asset map. Every worker shows up as a dot on the grove map with assigned shelter, ETA to shelter, and current status (working, en route, sheltered). Every piece of equipment — ladders, mechanical dusters, harvest totes — has a location tag and a storm-risk rating. The captain can see at a glance which assets need to be secured or evacuated and route crew to securing tasks if time allows. The NWS warning criteria — visibility under 1/2 mile and winds above 30 mph — govern the shelter-order threshold; HarvestHelm applies the same threshold as its default but lets the operation tune it per shelter capacity. The shelter-order logic itself builds on the sandstorm evacuation plan framework, which establishes the three-ring wadi-sensor architecture the storm bridge activates when the front crosses the action threshold.
The asset-risk ratings come from a pre-season inventory walk where each item receives a damage-risk score: high-wind-vulnerable (light ladders, tarps), projectile-risk (totes, pruning debris), and storm-hardened (secured equipment sheds, anchored containers). When the front-arrival clock drops below a configurable threshold, the helm pushes an asset-securing task list to available crew members ranked by urgency. Light ladders get pulled before tarp covers get secured, because flying ladders are a higher-risk item. After 3-4 storm seasons, the risk-rating library accumulates enough operation-specific data to refine the defaults, so a grove's asset-protection protocol gets sharper each year without the operations team having to re-think it from scratch.
The fourth panel is the decision log. Every action the captain takes — shelter order issued, harvest paused, irrigation triggers suspended, packing shed throughput rerouted — is timestamped and logged with the front-position data active at the moment of decision. This is both an audit trail and a replay feed for post-storm review. The decision log is what lets the operation turn every real storm into training material and what satisfies any labor-compliance audit the operation faces after the event.
The decision log also enables "what-if" replay where a different decision can be substituted at any point to see how the downstream consequences would have played out. This is particularly useful in post-season training when supervisors review borderline calls they made under pressure and ask whether an earlier shelter order or a different throughput adjustment would have produced better outcomes. Operations that run quarterly decision-log reviews report steady improvement in response times and decision quality over 12-18 months, because each reviewed event becomes operational memory that shapes the next response.
The yacht-navigation design of the storm bridge matters because under pressure, a supervisor does not have 20 seconds to find the right data source. The helm collapses the five-minute multi-tab routine into a three-click action sequence, and the captain keeps the whole situation in working memory instead of refreshing separate browser tabs. A supervisor trained on the console for three hours can run a full storm-response cycle without reference to any external site, which is the operational benchmark HarvestHelm targets and which separates the dashboard-as-single-source-of-truth approach from the "another tab" approach most grove operations currently suffer under.
Advanced Tactics for Multi-Grove Coordination and Post-Storm Recovery
The first advanced tactic is multi-grove coordination. Operations with two or more groves within a regional storm envelope face a coordination problem: which grove is evacuated first, which shelter shares capacity, which packing shed absorbs the displaced throughput. HarvestHelm's multi-grove console shows a zoomed-out view with all groves on one map and lets the captain designate a primary evacuation anchor and secondary support groves. The engine re-routes crew allocations and packing throughput in real time as the front moves. The single-grove coordination pattern scales to the multi-grove portfolio view without restructuring the underlying dispatch logic.
The second tactic is pre-staged recovery workflows. As soon as the front passes, the storm bridge transitions to recovery mode with a checklist: crew roll-call, injury triage, equipment damage survey, irrigation line pressure test, fruit damage inspection. Each checklist item has a mobile-app task assigned to the appropriate supervisor with photo and GPS evidence capture. The NWS Phoenix dust storm report reconstruction pattern shows that post-storm documentation quality determines how quickly operations recover to normal schedule. HarvestHelm's recovery mode is the same reconstruction discipline applied prospectively. For satellite-layer enhancements that feed both storm and recovery workflows, see dust plume satellite alerts, which extends the front-position telemetry with continental-scale plume tracking.
The third tactic is storm-season playbook drilling. The storm bridge supports a drill mode where the captain walks through a historical haboob on replay, making decisions with the same dashboard and receiving the same prompts the real event would generate. Oasis storm operation playbook refinement happens mostly during drills, not during storms, because under real pressure the captain runs the playbook they trained on. Operations that run quarterly drill sessions report 40-55% faster time-to-shelter-order compared to drill-free operations. The same dashboard-coordination pattern shows up in monsoon-arrival workflows for tropical mango operations; monsoon dashboard workflows runs the analogous storm-bridge design against a different weather hazard.
Collapse the Multi-Tab Routine Into One Helm View
Date grove storm triage during an active haboob warning window is too fast for a supervisor to multi-tab through six data sources. HarvestHelm's storm-bridge mode pulls satellite imagery, Doppler radar, wadi sensors, crew positions, and asset status onto a single console with a three-click action sequence. Book a pre-season storm-readiness review and we will audit your current haboob workflow against the console and show you where your multi-tab gaps cost response time. There is no upfront cost for the dashboard or the drill mode; the kilo-cut only activates on harvest delta above your baseline, and keeping the harvest delta positive starts with keeping the crew safe and the grove operating. Your supervisor has 90 seconds when the front hits; give them a single view.
Join the storm-bridge waitlist before the next khamsin window opens on your Medjool and Barhi blocks, and on day one the console will display live GOES overlay against your wadi-perimeter sensors with pre-configured shelter-order thresholds keyed to ladder-deployed palmero ETAs. Waitlisted Arizona and Coachella operators who onboarded ahead of last August's dust-plume sequence cut supervisor decision time from 5-minute multi-tab routines to 90-second three-click sequences, protecting crews during the exact 38-minute window between GOES detection and Sky Harbor visibility collapse.
The drill mode replays historical haboobs with the same dashboard prompts so supervisors build muscle memory before real storms arrive. Kilo-cut exposure only crystallizes after export-grade Barhi khalal and Medjool tamar cross the packhouse threshold, meaning the storm-bridge setup and drilling infrastructure sits on HarvestHelm's capital throughout the first 3-4 khamsin cycles. Cooperative managers supervising scattered parcels particularly benefit because the multi-grove coordination view converts portfolio-wide response from sequential supervisor scrambles into a single unified command surface that routes asset-securing tasks and shelter assignments across all properties simultaneously.