How to Map Uneven Fade Across a 90-Inch Quilt Face
The Problem With Looking at a Quilt Whole
A workshop specialist unrolled a 90-inch sampler quilt on a white-covered table and immediately saw the problem: the indigo blocks in the upper third read clearly blue, the center blocks read blue-gray, and the lower-left corner blocks were barely distinguishable from the cotton-white background. The turkey red sashing told a different story — deepest at the edges, lightest in a band roughly two feet from the top where the quilt had been folded repeatedly in storage. The weld yellow corner triangles were almost entirely gone.
If that specialist had mixed a single indigo reference bath based on the upper-third blocks, the center and corner blocks would come out over-dyed. If she had mixed to match the corner blocks, the upper third would look washed out relative to the original. There was no single correct concentration — there were at least five.
Library of Congress preservation guidance on light damage is unambiguous: light damage is cumulative and irreversible, and UV radiation from a window can cause dramatically uneven bleaching across a textile face depending on angle, season, and proximity. A quilt draped over a bed near a south-facing window accumulates exponentially more UV damage on the foot-facing panels than on the head-end panels tucked under a pillow — but both areas show as "faded" in a single-glance assessment.
Building a Zone Map: The Spatial Documentation Process
The AIC Textile Specialty Group documentation standards require photographing large textiles in sections, with a quadrant-by-quadrant approach for anything over three feet in any dimension. For a 90-inch face, that means a minimum of nine sections — a 3×3 grid — with consistent, even illumination for each shot. AIC standards for large textile documentation mandate that photographers record the ID, date, illumination type, and exposure settings for each section.
The practical workflow runs like this. Lay the quilt flat on a clean white surface with as few folds as possible. Photograph the full face first with ambient light for context, then move to section-by-section photography. For each section, note the original block type (Dresden Plate, Flying Geese, Nine-Patch, appliqué medallion), the presumed original colorants (indigo, madder, turkey red, logwood, cochineal, weld), and the observed fade state. Use a color reference card in at least one section shot per row.
The Smithsonian's photography guidance for large textiles adds raking light and UV photography to the standard ambient shots. Smithsonian textile photography protocol recommends raking light to reveal surface texture changes caused by dye loss — faded areas often show different fiber raising than intact areas because the mordant chemistry that holds the dye also affects cellulose behavior. UV photography can distinguish areas where original colorants remain from areas where the chromophore has broken down entirely.
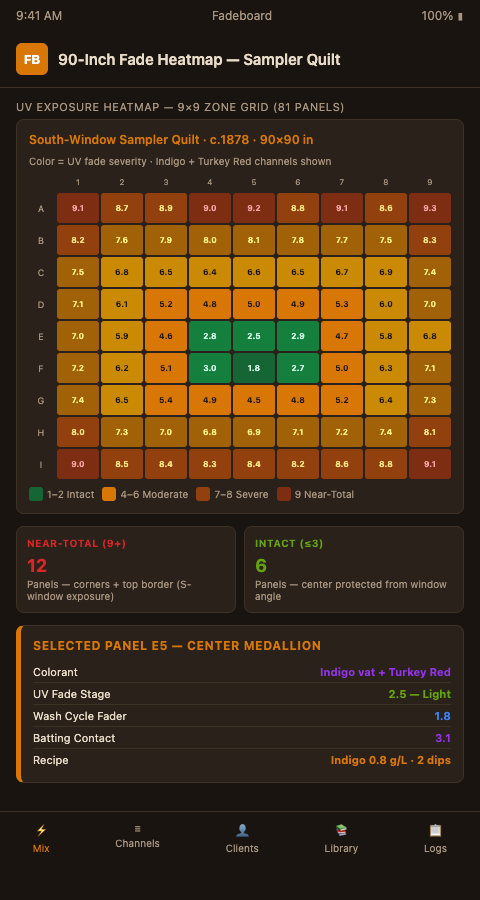
Once you have the photographic grid, transfer the fade observations to a paper diagram or a digital zone map. Number each panel, and for each panel record: dominant colorant type, estimated fade stage (light, moderate, severe, near-total), and the likely dominant degradation mechanism. This last step is where the soundboard fader logic enters: is this panel's fade primarily UV-driven (even bleaching, strongest at exposed edges), wash-cycle driven (overall color lift with pattern detail loss), or batting-contact driven (localized pale zones at quilting stitch lines)?
Fadeboard uses this zone map as the input for its panel-indexed recipe system. Each panel in the zone map becomes a channel strip in the Fadeboard workspace. The sun-exposure fader for panel A1 sits at a different position than for panel C3, because panel A1 spent its life under a window while panel C3 was folded into the interior of a storage stack. Those positions are not guesses — they are derived from the photographic evidence and the client's known storage and use history.
Reading the Patterns That Zones Reveal
Once the zone map is complete, the fade pattern itself becomes diagnostic. Fade that is strongest near the edges and diminishes toward the center almost always indicates environmental exposure — window light, gaslight proximity, or outdoor air circulation. Fade that is strongest in the center and diminishes toward the borders often indicates batting-contact pressure, where the center quilting was tighter and the batting contact more consistent. Fade that is uniform across the entire face, with pattern detail loss more severe than overall lightening, is the signature of repeated wash cycles with alkaline detergent.
Research on light damage at the zone level from the AIC confirms that zone-level monitoring is standard practice in museum conservation precisely because surface exposure is so uneven across large textiles. The Blue Wool Scale framework — the ISO 105-A01 standard for differential fade measurement — quantifies fade in relative terms, with each step representing a doubling of fade resistance. When you can place a panel's fade stage on that scale, you can calibrate the sun-exposure fader to a specific notch rather than an impressionistic setting.
For documenting quilt fade before work begins, the zone map is the primary deliverable of the pre-treatment survey. It anchors every subsequent dye decision to spatial evidence rather than memory.
Advanced Mapping: Fugitive Dyes and Cross-Panel Bleed
Sampler quilts with calico and chintz appliqué panels introduce a complication: fugitive dyes. Some 19th-century printed cottons used dyes with very low lightfastness — particularly early synthetic aniline dyes introduced after the 1850s, and some botanical yellow mordant dyes. These colorants may have faded so completely that the panel now appears a plain white or cream, with no visual evidence remaining of the original color.
Advanced analytical techniques used on heritage textiles — including fiber optic reflectance spectroscopy (FORS) and multispectral imaging — can identify residual colorant signatures even where visual fade is total. For workshop practitioners without laboratory access, the equivalent technique is to examine the back of the quilt. In many antique quilts, the backing fabric and the protected undersides of appliqué patches retain more of the original colorant than the exposed face. Compare every zone-map panel on the front with its corresponding area on the back, and note the difference.
Cross-panel bleed is a secondary problem in multi-yard restoration. Indigo, which is a vat dye and does not use a mordant, can migrate from dark panels into adjacent light-colored cotton in high-humidity conditions. A previously white muslin panel adjacent to a deep-indigo Flying Geese strip may have picked up a faint blue cast over 140 years. The zone map needs to capture this, because matching that muslin panel requires accounting for the absorbed indigo rather than treating it as pure white.
The 19th-century fade mapping starting workflow goes into the full condition assessment process for period quilts, including how to sequence the examination when a quilt has both fugitive and lightfast dyes present.
For ecclesiastical conservators working with similarly complex multi-panel textiles, Sarum red matching on medieval fragments addresses the equivalent challenge of identifying differential dye behavior across a fragmented textile ground.
From Zone Map to Dye Bath
With a completed zone map and panel-indexed fader positions established in Fadeboard, the path to the dye bath is systematic rather than intuitive. Mix the bath for the most-faded panel first — the smallest concentration required across the whole quilt. Test on a period-appropriate cotton swatch (feedsack cotton or unbleached muslin, not modern quilter's cotton). Adjust the fader position if the test swatch reads too light or too dark relative to the target panel, and document the adjustment.
Work from lightest to darkest across the panel index. Each bath is mixed to the concentration specified for that panel's fader positions, not to a single master concentration. The result is a set of dye records that, taken together, describe the entire quilt's color state with zone-level precision — and that any other workshop member, including an apprentice working a later session, can read and reproduce without guessing at the senior specialist's intentions.
Quilt restorers ready to treat a 90-inch face as a grid of independent fade problems — rather than a single undifferentiated fading surface — can join the Fadeboard waitlist and receive zone-mapping templates sized to the most common large-quilt formats. Bring your next intake piece, its storage history, and its block layout, and the panel-indexed recipe system will handle the rest.