Advanced Fragmentation Analysis for Reinforced Concrete Towers
Advanced Fragmentation Analysis for Reinforced Concrete Towers
A 2022 study of RC column demolition blasting found that the damaged zone extended well beyond the intended blast notch, with rebar deflecting unpredictably and fragments distributing across a mass-frequency curve that spreadsheets could not have predicted (ScienceDirect). That gap between expected and actual fragmentation is the source of most exclusion-zone violations and debris-field overruns in urban high-rise implosion.
Fragmentation analysis for reinforced concrete towers is not a secondary concern. The global construction and demolition waste management market is valued at $264 billion (Grand View Research), and a significant portion of that cost traces back to imprecise debris prediction — over-expanded exclusion zones, unexpected scatter, and post-blast cleanup that runs weeks over schedule. In dense urban blocks, a fragment that travels 30 meters farther than predicted is a liability, not a rounding error.
Why Reinforced Concrete Fragments Differently Than Plain Concrete
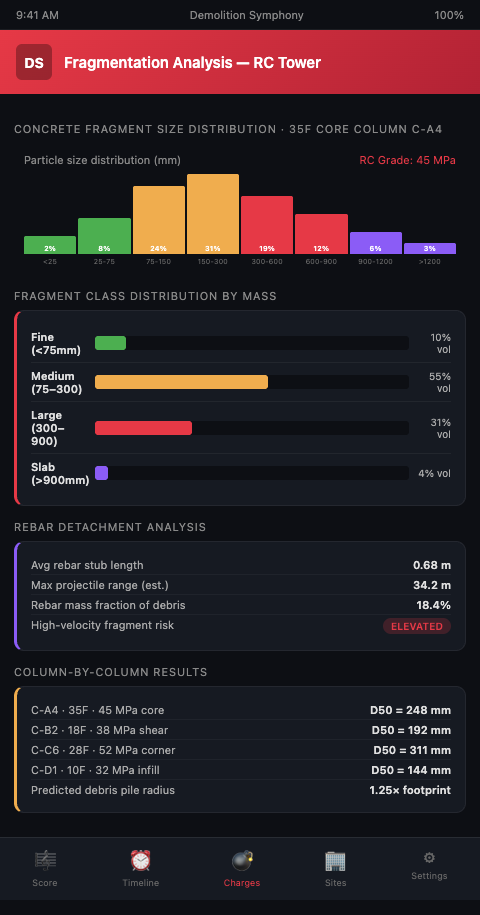
Plain concrete breaks in predictable patterns under blast load. Reinforced concrete does not. The steel rebar cage redistributes tensile and compressive forces across the section, storing elastic energy that releases as the concrete matrix fractures. When that energy discharges unevenly — as it does when charge placement is asymmetric or when rebar runs at variable pitch — the fragment distribution becomes multimodal: a population of fine dust-sized particles, a population of mid-size chunks, and a tail of large, high-velocity fragments that represent the greatest hazard. Rebar concrete demolition fragmentation behavior is fundamentally different from plain concrete because the reinforcement acts as both a restraint and an energy-storage mechanism: it prevents early fracture while accumulating elastic strain, then releases that strain across multiple fracture planes when the concrete matrix finally fails. Post-blast concrete fragment prediction must account for this mechanism to produce reliable exclusion zone inputs.
Research using ALE-FEM-SPH coupled simulation has validated this behavior at the component level: spalling area, fragment velocity, and size distribution all shift nonlinearly as charge geometry changes (MDPI Applied Sciences). The simulation approach accounts for the fluid-structure interaction during the blast wave's arrival at the concrete face, the subsequent crack propagation, and the ejection velocity of separated fragments.
A second validated approach — the Fragment Graph Network (FGN) — uses machine learning to predict fragment mass, size, and velocity directly from structural parameters and charge configuration (ScienceDirect). The FGN treats each potential fracture surface as a node in a network and models fragment formation as a graph partitioning problem. In practice, it produces probabilistic fragment size distributions that can be mapped to exclusion zones with defined confidence levels.
The Demolition Score as a Fragmentation Map
In the Demolition Symphony Planner, each charge placement on the visual demolition score carries fragmentation metadata alongside its timing delay. When you notate a column cut at Floor 8, Section C, the score layer beneath it shows the predicted fragment cloud: a color-coded cone extending outward from the cut, with concentric rings marking distance thresholds for 50th, 90th, and 99th percentile fragment travel.
This visual approach changes how coordinators read the score. A timing sequence that looks clean from a collapse-direction standpoint may reveal overlapping fragment cones at the 90th percentile level — two charges on adjacent columns whose debris footprints intersect within the exclusion boundary. Those conflicts are invisible in tabular delay schedules. On the score, they appear as orange overlap zones that require either charge repositioning, additional delay separation, or physical shielding.
The musical metaphor holds: a composer writing for brass and woodwind in the same register must manage the acoustic interference. A demolition coordinator writing charges for adjacent columns must manage the fragmentation interference. The Demolition Symphony Planner enforces this discipline at the annotation layer, not the post-event review layer.
For super-tall building scenarios, fragmentation complexity scales faster than floor count. A 40-story tower has roughly four times the concrete volume of a 10-story structure, but its rebar density, post-tensioning cables, and column cross-sections are also heavier — which means the fragment energy budget per charge is higher. The ALE-FEM-SPH models that work reliably for low-rise test specimens must be recalibrated against higher concrete grades and larger rebar diameters before they apply to supertall demolition.
Combining Fragmentation Load with Blast Impulse
One underappreciated variable in reinforced concrete implosion debris patterns is the combined loading effect. When a blast wave and its associated fragmentation impulse arrive at an adjacent structural member — a column, a slab edge, a shear wall — they create a combined load that exceeds what either component alone would produce (International Journal of Impact Engineering, Springer).
For urban high-rise demolition, this matters because adjacent structural members are often retained portions of the building — lower floors still standing while upper floors have collapsed — or neighboring structures within the blast shadow. The combined blast-fragmentation load can crack columns that were expected to remain intact, changing the collapse geometry mid-sequence.
The practical implication: fragmentation analysis cannot be scoped to a single charge in isolation. Each charge's fragment cloud must be tested against the structural state of the building at the moment that charge fires — which depends on the delays already elapsed and the collapses already in progress. This is a temporal problem that static spreadsheet models cannot solve. It requires simulation stepping through each delay interval and updating the structural state before evaluating the next charge's fragmentation load.
Implosion produces heavily mixed and shattered debris; concrete and glass fragmentation is one of the primary waste management challenges in post-blast cleanup (MDPI). Accurate pre-blast fragmentation maps reduce the cleanup area, concentrate debris containment resources, and shorten the site re-entry timeline.
Tactics for High-Accuracy Fragment Prediction
Start with rebar geometry extraction. GPR scanning or destructive core sampling at representative column locations gives you actual rebar pitch, bar diameter, and splice locations. Assumed rebar geometry produces fragmentation models that diverge from reality by 30-40% in fragment velocity; measured geometry closes that gap significantly.
Classify the concrete matrix. High-strength concrete (above 50 MPa) fragments differently than standard 30 MPa mix. Its fracture energy is lower relative to its compressive strength, which produces more fine particles and fewer large chunks — but the fine particle cloud travels farther and penetrates shielding more aggressively.
Test the model at a sacrificial column. Before the main event, a full-charge test at one column of representative geometry lets you validate model predictions against observed fragment scatter. The data collected — through high-speed camera, acoustic sensor, and post-blast fragment mapping — calibrates the FGN or ALE-FEM-SPH model for that specific building.
Layer fragment cones on the exclusion-zone plan. The 99th percentile fragment travel distance from the validated model defines the hard exclusion boundary. The 90th percentile defines the zone where personnel in blast-rated PPE may operate. The 50th percentile approximates the main debris field boundary for cleanup resource staging.
For collapse strategy comparison, note that simultaneous collapse releases peak fragment energy across all floors at nearly the same moment. Progressive collapse staggers that release, allowing fragment clouds from lower floors to settle before upper-floor charges fire. In dense urban blocks, progressive sequencing typically reduces the 99th percentile fragment boundary by 15-25% compared to simultaneous — a meaningful reduction when the nearest occupied building is 80 meters away.
For cross-material comparison, the fragmentation dynamics in reinforced concrete towers share structural logic with segmental concrete bridge disassembly, where segment-by-segment removal controls fragment scatter along a constrained right-of-way — the same principle of staged release applied to a different geometry.
Conclusion
Fragmentation analysis for reinforced concrete towers is a quantitative discipline, not a conservative-estimate exercise. FGN models, ALE-FEM-SPH coupling, and combined blast-fragmentation load assessment now provide the resolution that urban high-rise implosion coordinators need to set defensible exclusion zones and realistic debris containment perimeters.
Urban high-rise implosion coordinators working with reinforced concrete towers of 20 stories or more need pre-blast fragment prediction at the charge level, not the building level. The Demolition Symphony Planner's fragment annotation layer integrates directly with your delay score, so every charge on every floor carries its own validated debris cone before the first blasting cap is connected. Join the waitlist to run your next RC tower implosion with fragment maps built into the score from day one.