Machine-Learned Wave Prediction for School Booking Calendars
What Your Booking Calendar Is Missing
A typical school booking calendar entry looks like this: P.S. 142, 34 students, third grade, Tuesday 10:00 AM arrival, Water Cycle cluster requested, two chaperones, lunch at 12:30. That's a scheduling record, not a wave-pressure forecast. It tells your ops team who is coming but not what will happen on the floor when they arrive.
The gap between a booking record and a pressure forecast costs children's museum designers real bypass events. A third-grade group of 34 high-energy students arriving after a 45-minute bus ride generates a materially different flow signature than a 34-student group that walked three blocks from a nearby school. An April booking falls during a museum visit season when school groups are motivated and alert; a December booking comes with kids who are distracted and tired. None of those variables appear in a standard reservation record.
This isn't a failure of the booking system—it was never designed to carry wave-pressure information. It was designed to schedule visits and collect payment. The data enrichment that makes a booking record into a pressure forecast requires an additional layer: a model that takes the booking metadata and translates it into predicted wave behavior on the floor. That translation layer is what ML wave prediction provides.
Museum Visitor Forecasting Using DL and Sentiment (PLOS One) demonstrates that transformer models trained on structured attendance data outperform traditional regression approaches for predicting visitor behavior patterns. The same architecture that improves aggregate attendance forecasting can be directed at the specific problem of predicting wave shape: how fast a group enters, how quickly the leading edge separates from the middle, and which station clusters are likely to see bypass.
National Gallery AI Attendance Prediction (Computerworld) documents a live deployment where the National Gallery used AI prediction to reduce overcrowding and improve scheduling. Their system used historical booking patterns as the primary training signal—exactly the data children's museums already collect through reservation intake.
Building a Wave-Prediction Model on Your Booking Data
Before covering the model architecture, it's worth naming the problem that makes wave prediction genuinely hard for children's museums specifically: you're forecasting behavior for a population that varies radically by a variable—grade level—that isn't visible in most booking system outputs. A Monday with three third-grade groups looks identical in a standard calendar view to a Monday with one second-grade group, one fifth-grade group, and one mixed K-2 group. Those two Mondays will generate completely different pressure profiles on your floor. Wave prediction only becomes useful when the model can see the grade-level composition of your upcoming bookings, not just the headcount.
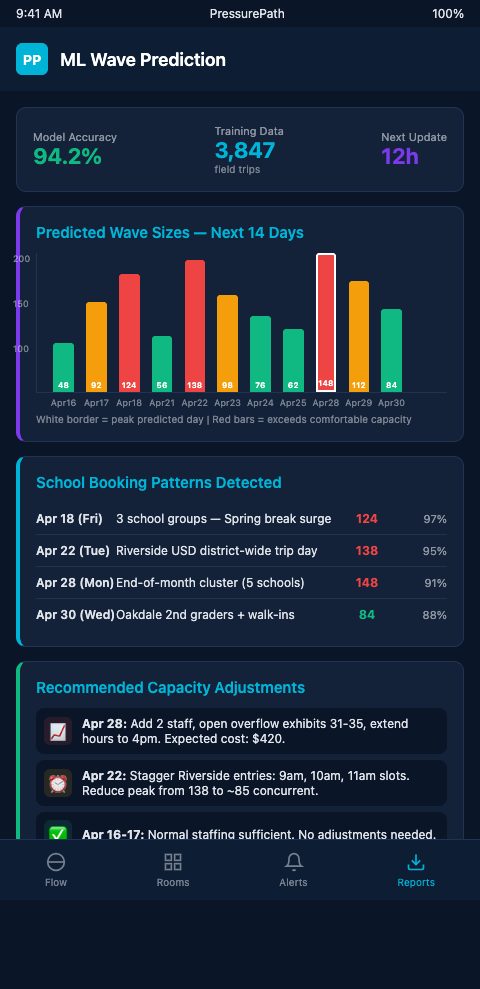
PressurePath treats school-group wave prediction as a pipe-pressure forecasting problem. Given what you know about a group at booking time—grade level, group size, school district, arrival time, season, and prior visit history—the model predicts the pressure profile of the wave before the bus pulls up. That profile includes estimated entry velocity, expected leading-edge separation time, and bypass-risk scores for each station cluster on your floor.
The training pipeline requires four data layers. First, historical booking records with group metadata: grade, size, school type, and arrival time. Second, historical floor-flow data from sensor deployments showing actual wave behavior on past visit days. Third, session-level outcomes including which stations were bypassed and which captured the wave. Fourth, contextual variables like season, day of week, and concurrent booking load.
Predicting Art Museum Visitors with Deep Learning (Nature) confirms that integrating structured booking data with contextual signals improves visitor forecasting precision. The key is treating the booking record as a feature vector rather than a scheduling entry: grade level encodes developmental wave-behavior expectations, group size encodes pressure magnitude, and arrival time encodes energy state.
Early Prediction of Engagement in Science Museums (ACM) pushes the prediction horizon further: ML models at science museums can achieve early prediction of per-station visitor engagement, meaning the model's forecast can be useful before the group even enters the building. For a museum with a $180K NSF-funded Water Cycle puzzle in the path of a high-pressure third-grade wave, an early-warning forecast gives the ops team 15 to 30 minutes to position docents, adjust rope partitions, or trigger a stagger with the next incoming group.
Visitors Flow Management at Uffizi Gallery (Springer) demonstrates queue management using predictive analytics to assign optimal entry times. That's the booking-calendar intervention PressurePath enables: not just recording when groups arrive, but recommending which time slots to offer based on current booking density to minimize wave collision events on high-pressure days.
Versai School Group Reservation tracks demographics at reservation time creating exactly the dataset that ML wave-prediction models need. If your reservation system already collects grade, group size, and school type, the data pipeline for a wave-prediction model is shorter than most exhibit designers expect.
The wave-prediction output from PressurePath feeds directly into multi-grade predictive modeling: once the system can predict wave shape per group type, it can extend that prediction to mixed-grade days where multiple group types arrive within the same two-hour window, generating compound pressure profiles that no individual station capacity analysis captures.
One practical implementation detail: the model's accuracy improves substantially when you include first-visit vs. return-visit indicators in the booking metadata. A school group visiting the museum for the first time generates a higher entry-velocity profile—students haven't seen the floor before and move faster through unfamiliar space. A return-visit group from the same school often shows lower leading-edge separation because students remember the stations they liked and navigate directly toward them. That behavioral distinction is predictable from the booking record and produces meaningfully different bypass-risk scores for the same grade and group size.
From Forecast to Floor Response
A wave-pressure forecast without a response protocol is just an interesting data visualization. The actionable piece for children's museum exhibit designers is a set of floor-response playbooks that match specific forecast profiles to specific ops decisions.
For a high-pressure wave forecast—a group of 34 or more third-graders arriving after a long bus ride on a morning slot with another group booked 20 minutes later—the playbook might include: extend the entry-stagger window to 18 minutes, position a docent at the atrium's main pressure-drop point, activate the rope partition configuration that narrows the bypass corridor past the Water Cycle approach.
For a moderate-pressure wave—a mixed fifth-grade and sixth-grade group of 28 students arriving on foot from a nearby school at 11:00 AM—the playbook is different: shorter entry stagger, docents positioned at the scientifically complex stations that upper-elementary groups respond to, and a minimal partition configuration because the group's lower entry velocity means the leading-edge separation problem doesn't apply.
The playbook library accumulates through use. Each visit generates data on whether the pre-visit playbook produced the expected bypass reduction. Visits where the forecast was accurate and the playbook worked confirm the model's reliability for that group profile. Visits where the forecast was off—a group moved more slowly or quickly than predicted—provide calibration data that improves future forecasts for similar group types.
Big Data Visitor Trends in Museums (DataCalculus) confirms that statistical models using historical booking data to project visitor wave patterns are now operationally viable for mid-size institutions. The infrastructure cost has dropped to the point where a children's museum running 150 or more school group visits per year has enough data to train a useful wave-prediction model from its existing reservation records.
For the ML flow forecasting parallel: multi-room escape room franchises face identical wave-prediction problems during holiday peaks, where back-to-back group bookings create compounding pressure. The children's museum context is more complex because grade-level variance introduces behavioral heterogeneity that holiday bookings don't—but the core forecasting architecture is the same.
The practical outcome of wave-prediction integration is a booking calendar that does more than schedule: it surfaces bypass risk at the point of booking, recommends stagger windows, and flags days where the cumulative wave load will exceed your floor's absorption capacity. That's the difference between a calendar that records history and one that shapes flow.
Museums that have run wave-prediction models for a full school year consistently report a secondary benefit: the model's forecast error decreases over time as actual session data is incorporated into the training set. A model trained on two years of booking and floor-flow data from your specific institution is substantially more accurate than a generic visitor-demand forecasting model, because it has learned the behavioral signatures of your specific student populations, your specific floor geometry, and your specific docent configurations. That institutional specificity is what makes PressurePath's wave-prediction output actionable rather than merely indicative.
Forecast Your Next School Wave Season Before It Starts
The wave-prediction model's output becomes operationally useful at the floor level in two ways. First, it informs pre-visit configuration: knowing that the 10:00 AM booking is a high-pressure third-grade group means the floor can be configured for a high-velocity wave before 9:50 AM rather than reacting to the wave after it arrives. Second, it informs booking-time decisions: when a school coordinator calls to book a visit, the system can surface current booking density on the requested date and recommend alternative time slots that would reduce compound wave pressure—a service that schools appreciate and that reduces your bypass incidents simultaneously.
For a children's museum running 200 or more school group visits per year, those two applications of wave prediction represent a meaningful operating efficiency. The docent hours spent redirecting waves that could have been forecast and pre-empted are hours that could be spent on educational engagement. The booking coordinator conversations that could offer intelligently staggered time slots rather than just calendar availability improve both the museum's floor performance and the school's experience. PressurePath's wave-prediction layer makes both of those outcomes accessible from data your museum is already collecting.
PressurePath is designed for children's museum exhibit designers who want to stop learning from bypass events after they happen and start preventing them before the bus arrives. If your reservation system already collects group metadata, you have the data to run a wave-prediction model. Join the waitlist to see how PressurePath connects your booking calendar to your floor's pressure map.