Reading the Wave: Detecting Skipped Stations Before the Bus Leaves
The 4-Minute Recovery Window
At 11:23 AM, the teacher from P.S. 142 starts counting heads in your exit atrium. The bus leaves at 11:35. You have, at most, 12 minutes—and realistically 4–8 once coats are gathered and stragglers are collected from the water table—to send the group back to any station they missed.
Most museums never try to use that window, because they don't know which stations were skipped until the post-visit survey comes back three days later. By then the group is gone, the grant outcome is missing, and the evaluation report has a blank row where the Water Cycle puzzle data should be.
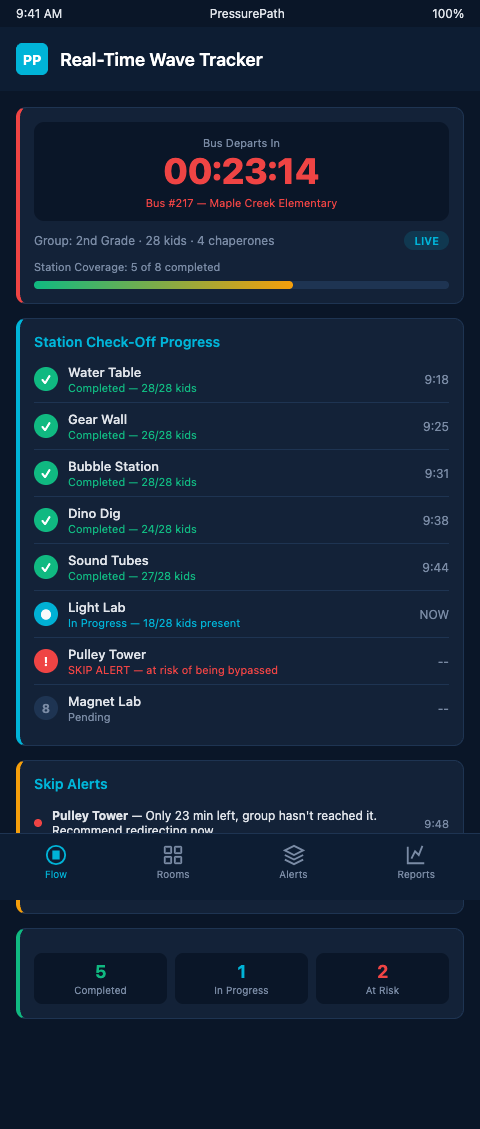
The real-time wave-read technique changes that calculus. By monitoring station occupancy and dwell time throughout the field trip, you can detect a bypass event while the school wave is still in the building—and redirect the wave to the skipped station before the bus pulls away. The 4-minute recovery window is real. Most museums don't know it exists because they've never built the detection layer that would tell them a bypass happened at 10:47 rather than in a survey response on Thursday.
The scale of the problem justifies building that detection layer. A single field trip group that misses the NSF-funded exhibit represents not just one missed learning outcome—it represents a documented gap in grant evaluation data. Over a season of 40 school group visits, even a 30% bypass rate on the primary learning exhibit means 12 groups' worth of learning outcomes that never activated. That's a renewal application that requires explanation, or a grant report that shows the centerpiece exhibit reached 70% of its intended audience.
How Wave-Read Detection Works
Wave-read detection starts with sensor coverage at the station level. Xovis occupancy and flow sensors deployed per exhibit zone provide the data layer for detecting skips in real time—each sensor reports whether a zone has been entered, how many children entered, and how long they stayed. That data, cross-referenced against the school wave's entry time and known sweep rate, produces a per-station bypass flag within minutes of the wave passing through. The sensor placement principles here parallel those used in escape room franchises, where auditing photo-op flow without cameras applies similar real-time occupancy detection to identify bypass events in attraction spaces.
Museum analytics tools using heat maps and dwell-time data identify which exhibits are bypassed and at what peak times—but most implementations analyze that data retrospectively rather than in real time. The wave-read approach requires a live dashboard that flags bypass events while the group is still on the floor. That requires a different configuration: not batch analytics that runs overnight, but a streaming data layer that compares observed occupancy against expected occupancy in near-real-time.
Multimodal Bayesian models for predicting dwell time per station enable real-time skip detection by comparing observed dwell against modeled expectations. A station that should generate 3–4 minutes of engagement per group and receives 0 seconds triggers a bypass alert. That alert goes to a docent or floor coordinator, not to a post-visit database.
The signal calibration matters. Beverly Serrell's SRI and %DV metrics are the accepted benchmarks for measuring exhibit bypass. SRI (Sweep Rate Index) measures visitors per minute per 100 square feet; %DV (Percent Diligent Visitors) measures the fraction of visitors who stopped at an exhibit for a meaningful duration. For a 30-kid school wave, a station with %DV below 20% under normal conditions is structurally bypass-prone—the wave-read system should flag it automatically, both as a real-time alert and as a pattern indicator for floor plan redesign.
PressurePath's Bypass Detection Layer
PressurePath models the school wave as pressurized fluid moving through your floor plan and predicts which stations will fall into bypass shadow before the field trip day arrives. On the day itself, the real-time monitoring layer compares actual wave movement against the predicted pressure map.
When a station that the model predicted would receive 60% contact from the wave instead receives 10%, the discrepancy is flagged immediately. The floor coordinator sees the alert, positions a chaperone or docent at the station entry, and intercepts the next sub-group before they sweep past. The intervention takes 60 seconds to execute. The resulting station stop takes 4 minutes and generates the learning outcome documentation the grant evaluation requires.
The bypass detection system has three alert tiers. Tier 1 is a structural pre-alert: stations identified by PressurePath's pressure model as high-bypass risk receive a chaperone positioning cue 10 minutes before the wave is expected to reach them. This is not a response to a detected bypass—it's a prevention action based on predicted wave behavior. Tier 2 is a real-time bypass alert: a station that receives below-threshold occupancy within the expected window triggers an immediate intervention cue. Tier 3 is a recovery alert: 20 minutes before estimated departure, any priority station that has not received adequate contact triggers a group recovery request.
Chaperone behavior data functions as a viable proxy signal for group bypass detection even without sensors—a chaperone observed walking past a station rather than stopping at it is a real-time indicator that the group bypassed that zone. Trained docents watching chaperone behavior can flag bypass events manually when sensor coverage is incomplete. In a museum with limited sensor infrastructure, a two-person observation team during field trip hours can run a manual wave-read with near-equivalent effectiveness for the top-priority stations.
Narrative-framed exhibits measurably extend dwell time compared to static equivalents, making them lower bypass-risk targets—but even well-designed stations miss groups under high-pressure wave conditions. Wave-read detection targets the structurally weak-narrative stations first, because those are the ones where a real-time redirect produces the largest learning recovery.
Building the Detection Infrastructure
Wave-read detection requires two infrastructure components: a sensor or observation layer that generates per-station occupancy data, and a model layer that translates raw occupancy data into bypass events relative to expected behavior. The model layer is what PressurePath provides—the baseline expected behavior for each station under each wave density condition, against which observed data can be compared in real time.
For museums without existing sensor infrastructure, the lowest-cost starting point is a tally counter at each priority station—a staff member or volunteer who records group entries and exits during field trip hours. That data, entered into a simple spreadsheet, produces a per-visit station contact record that's far more useful than post-visit survey data for identifying bypass patterns.
Sensor-based detection adds another layer of granularity. Occupancy sensors at station entries count wave density in real time—the system knows how many children crossed the station threshold and how long they stayed. When that number is compared against the expected value from PressurePath's model, the discrepancy either confirms the model's bypass prediction or flags an unexpected bypass event that requires immediate response.
The detection infrastructure also produces longitudinal data that's valuable beyond individual field trip days. Across a full season of school visits, the per-station contact log reveals which exhibits consistently underperform, at what wave densities the bypass patterns change, and whether specific interventions (a new partition, a chaperone script change, a scheduling adjustment) produced measurable improvement. That data is exactly what grant evaluators and education directors need to make the case for floor plan changes.
The key shared insight across attraction spaces is that bypass events are almost always detectable in real time through simple occupancy signals, but operators don't set up the detection layer until they've lost a season's worth of data.
The 30-kid wave primer covers the mechanics of why waves form and bypass; this post focuses on detecting those bypasses in time to act. For the longer-term data layer that shows bypass patterns across multiple field trip days, educator dashboards for bypass patterns extends the detection approach into systematic floor plan evaluation.
What Real-Time Detection Changes
The difference between detecting bypass in post-visit surveys and detecting it in real time is the difference between a historical record and a recovery opportunity. Post-visit data tells you that P.S. 142's third-grade class missed the Water Cycle puzzle. Real-time detection tells you at 10:47 AM that they missed it, with 48 minutes left before the bus leaves.
A docent positioned at the puzzle station entry at 10:48 can intercept the subgroup currently at the water table and direct them through the station before the group reconsolidates for lunch. That recovery takes four minutes. It generates the documented engagement your NSF evaluation requires. And it happens because you knew the skip had occurred while you still had time to act.
Over a full season, real-time detection compresses the bypass rate on priority stations from whatever its baseline is—often 30–60% for mid-floor science exhibits—toward single digits. The floor plan doesn't change. The exhibits don't change. The detection and response layer converts structural bypass risk into documented engagement, one field trip day at a time.
PressurePath's bypass detection layer is available in the early access program for children's museum exhibit designers. If your floor plan runs school waves past critical learning stations, we'd like to model it—and show you exactly where the bypass events occur before the next field trip day.