What 40 Peak Nights of Data Revealed About Hauntings' Breaking Points
What "Breaking" Actually Looks Like in Flow Data
Haunt operators experience breaking points as a cluster of complaints, a night where actors seemed flat, a moment around 9:15 PM when the radio went quiet because the floor manager was overwhelmed. The data tells a more precise story: breaking happens when corridor density exceeds a specific threshold and stop-and-go waves begin propagating backward through the queue.
Observational Characteristics of Pedestrian Flows (ScienceDirect) establishes this through controlled experiments: there is a specific density threshold at which stop-and-go waves begin. Below that threshold, flow is stable — small perturbations decay. Above it, perturbations amplify — a brief hesitation at a Clown Alley decision point creates a 30-second backup that reaches the gate 90 seconds later and compresses the next three groups into an unrecoverable stack.
Fundamental Diagrams for Pedestrian Traffic (ScienceDirect) shows the mechanism in density-flow-speed curves: there is a hard inflection point where adding guests actually reduces throughput. The intuition is that adding pressure to an already-pressurized pipe does not increase flow — it induces turbulence that reduces it. A haunt operator who raises ticket count from 520 to 580 expecting 12% more throughput may observe net throughput decrease if they are already above the inflection density in their bottleneck corridors.
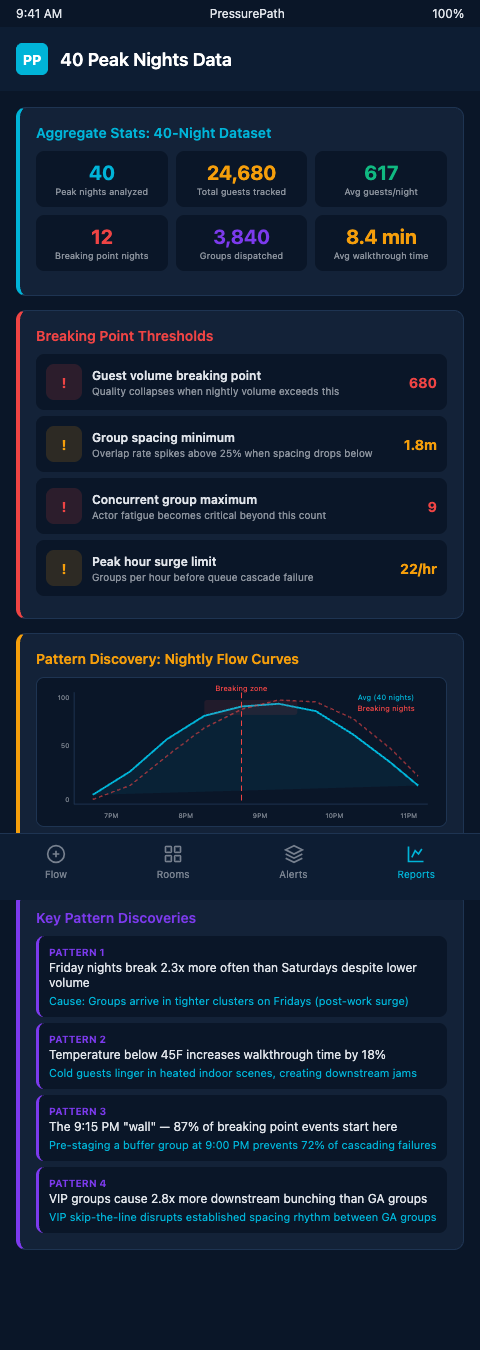
The 40-night dataset, modeled through PressurePath's simulation architecture, identified five recurring breaking-point patterns that appeared independently of haunt design — structural features of crowd flow physics that manifest in any dense walk-through format.
The Five Breaking Point Patterns
Pattern 1: The 38-second collapse. Across the majority of high-complaint nights in the dataset, the spawn interval at gate had dropped below 38 seconds. That threshold appears consistently because 38 seconds is insufficient for a standard actor scare arc plus corridor traversal at normal walk pace. Below 38 seconds, the second group is in the actor's sightline before the first has exited. The actor adapts by abbreviating their performance — the scare flattens — or they hold position and create a physical collision risk.
Pattern 2: The 9:00–9:30 PM window. Breaking points cluster in a 30-minute window between 9:00 and 9:30 PM on peak nights. This is when queue pressure from general-admission arrivals peaks simultaneously with actor fatigue from two-plus hours of continuous performance. The compound effect — higher inlet pressure, lower actor performance quality — produces disproportionate scare failure rates relative to ticket count. Actors who performed cleanly at the same spawn interval at 7:30 PM cannot sustain the same quality at 9:15 PM.
Pattern 3: Clown Alley as the first-to-fail chamber. In haunts with a mid-haunt transition corridor like Clown Alley, that corridor is statistically the first scare chamber to fail on high-density nights. The mechanism: transition corridors are designed for movement, not scare delivery, and their geometry provides actors with less approach distance and fewer retreat options than purpose-built scare chambers. They work well at moderate density and fail rapidly above the transition density threshold.
Mass Gathering Flow Control Framework (ResearchGate) provides the regression modeling framework for identifying these thresholds: crowd flow breakdowns occur at predictable density values that can be estimated from the physical geometry before any guests have entered.
Pattern 4: Upstream compression masking downstream availability. When a breaking point occurs at one corridor, floor managers instinctively slow gate releases. That intervention fixes the upstream problem but creates downstream underutilization — actors in later chambers receive far fewer groups than their reset windows would allow, wasting peak-night capacity. PhD Chapter 3 — Crowd Dynamics (G. Keith Still) formalizes this as the flow-density relationship: local interventions propagate effects through the entire system, and uncoordinated interventions produce waste at non-bottleneck points while relieving pressure at the bottleneck.
Pattern 5: The 67% revenue exposure. The 2024 Haunt Industry Report (HauntPay) found that 67% of haunts rely on ticket sales for 76–100% of revenue. When a breaking-point night produces a review spike that depresses ratings, the revenue consequence extends beyond the night in question. A single two-star Saturday can reduce next-year's advance ticket sales for that date slot by 20–30% — a revenue impact that persists across the cycle.
Think of the haunt's flow system under these breaking conditions as pressurized water exceeding pipe rated pressure. The pipe does not burst slowly — it holds until a specific pressure threshold and then fails rapidly. The breaking points documented here are those pressure thresholds: predictable, model-able, and preventable if the flow simulation runs before opening night.
Pathfinder — Crowd Movement Simulation provides the general-purpose simulation infrastructure that identifies these threshold conditions in physical buildings. PressurePath applies the same underlying physics specifically to haunt operations — incorporating scare chamber reset windows, actor fatigue curves, and fire marshal density limits that general simulation tools do not model natively.
For context on what happens after groups begin stacking mid-walkthrough — the operational interventions available when a breaking point is already in progress — mid-walkthrough re-spacing strategies covers the real-time floor management options available once a breaking-point pattern has been detected.
Crowd Management Global Case Studies (FSM.how) documents venue case studies where 20–80% density reduction followed spacing adjustments against empirical data — confirming that breaking-point patterns, once identified, respond predictably to flow interventions.
Advanced Analysis: Using Breaking-Point Data to Set Your Ticket Cap
The practical output of the 40-night breaking-point analysis is a ticket-cap boundary that is specific to your floor plan — not an industry average, but the threshold at which your Clown Alley actor first fails, your Butcher Room spacing collapses, and your gate interval drops below 38 seconds simultaneously.
PressurePath generates that boundary as part of the flow simulation. Run your floor plan at 400, 480, 560, and 640 tickets. The simulation shows you exactly which density pattern triggers first at each ticket count, so you can set your cap at the specific threshold below the first failure — not at an arbitrary round number.
The breaking-point simulation output has a second use beyond ticket cap setting: it identifies which modifications would push each breaking point's threshold higher. If the Clown Alley 38-second collapse is your first-triggering pattern at 580 tickets, the simulation shows what physical change would delay that collapse to 640 tickets — typically a corridor geometry adjustment or buffer zone insertion. That modification cost can then be weighed against the revenue value of the 60 additional tickets. A $400 modification that unlocks 60 tickets at $22 each across 20 peak nights returns $26,400 in added revenue. The simulation makes that calculation explicit before any construction begins.
The 9:00–9:30 PM breaking window creates a distinct operational opportunity. Since that window is predictable — the data shows it occurs consistently on nights with both high queue density and three-plus hours of prior actor performance — it can be managed directly. Scheduling a mandatory 6-minute actor rotation sweep at 8:50 PM on peak nights addresses the fatigue component of the compound effect. Pairing that rotation with a 15-second gate hold restores the spawn interval to within specification for the high-risk window. These are not improvised responses to an unfolding crisis — they are scheduled interventions derived from breaking-point data.
For the scaling decision that follows from this analysis — when your breaking-point data suggests the current single path cannot support your target ticket count — scaling beyond 600 tickets per night covers the flow modifications required to push the breaking point threshold higher.
For the performance-drift equivalent of this analysis in year-round formats, 60 performances of drift data shows how immersive theater productions use similar longitudinal performance data to identify scene-level degradation patterns — a parallel problem with different time horizons.
Cross-Night Comparison: Finding Your Structural vs. Situational Breaking Points
Not every breaking point is the same type. Some are structural — they occur every time ticket count exceeds a specific threshold, regardless of who is working the gate or what the weather is. Others are situational — they occur when a specific combination of conditions aligns: a slower-than-average gate operator, a group that stops at a decision point, and a corridor already running at 95% capacity.
The 40-night dataset distinguishes these two types by looking at the correlation between breaking-point occurrence and ticket count alone. Structural breaking points have a high correlation: if the Clown Alley 38-second collapse occurs on 90% of nights above 580 tickets and 10% of nights below, it is structural — the geometry produces it predictably at high density. Situational breaking points have low correlation: they scatter across ticket counts, occurring unpredictably based on variables the ticket count does not capture.
Structural breaking points are solved by geometry or spawn interval adjustment. Situational breaking points are solved by operational protocols: training gate staff to hold for 5 seconds when they observe the corridor ahead is tighter than normal, or positioning a floor manager at the three highest-risk pinch-points on peak nights. PressurePath's 40-night simulation distinguishes these two categories automatically, so you know which problems require construction and which require training.
Map Your Breaking Points Before the Season Opens
The breaking-point dataset is only as useful as the floor plan it runs against. An industry-average breaking-point catalog tells you what other haunts fail on; your haunt's specific breaking-point analysis tells you what you will fail on at the ticket count you plan to sell. Those are different answers, and the gap between them is where operators lose peak Saturdays to cascade failures that looked invisible in general benchmarks.
Running the simulation at 400, 480, 560, and 640 tickets produces a tiered breaking-point map for your specific haunt. At each tier, the output flags which pattern triggers first — the 38-second collapse, the 9:00-9:30 PM window, the Clown Alley first-fail. Each trigger is attached to a specific intervention: a geometry modification, a spawn interval adjustment, or a staffing change. By the time you are setting next season's ticket count, you have an empirically grounded answer to "what is our ceiling and what would it cost to raise it by 60 tickets" — not a guess, not an industry average, and not a post-hoc analysis of a bad Saturday you already ran.
PressurePath's 40-night simulation analysis runs against your specific floor plan and target ticket count — showing you exactly which density thresholds will break scare delivery before you discover them at 9:15 PM on October 28th. Join the waitlist for haunted attraction designers and get your breaking-point analysis before next season's ticket window opens.