Scaling a Haunt Beyond 600 Tickets Per Night Without Breaking Scare Delivery
When 600 Tickets Becomes the Enemy of Your Scare
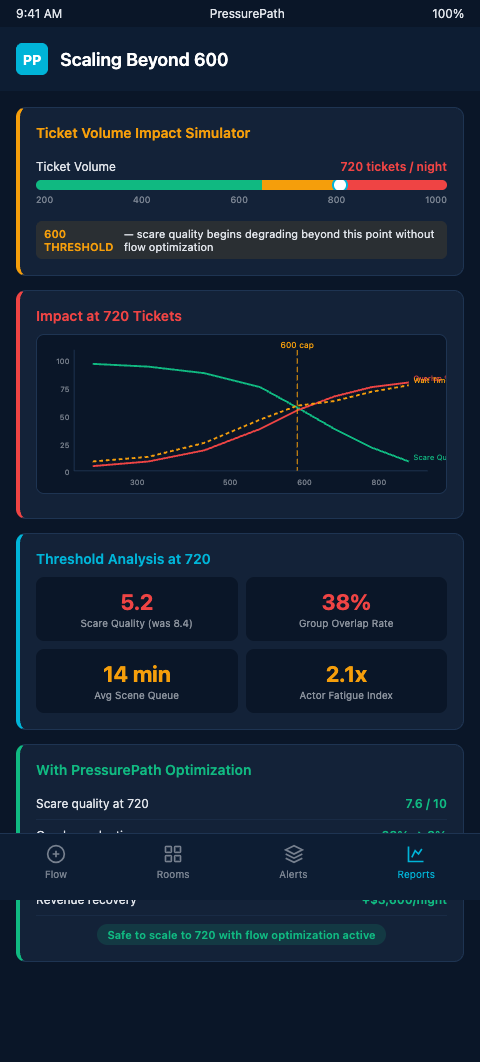
A single statistic from Calculating Your Haunted House Capacity (HauntPay) cuts to the core of this problem: groups of six entering every 25 seconds puts roughly 500 guests through per night, and operators who compress that interval to chase higher ticket counts routinely destroy the scare delivery they spent months designing. The math is simple. The consequences are not.
The crush happens at pinch-points — hallway bends, Butcher Room entries, Clown Alley exits — where groups stack behind each other before the previous scare has finished. Research on pedestrian flow dynamics confirms this: once corridor density exceeds roughly 2–3 pedestrians per square meter, flow rate actually drops as stop-and-go waves propagate backward through the queue, according to Fundamental Diagrams of Pedestrian Flow (Springer). At 600+ tickets per night, you hit that ceiling in every high-friction zone of your haunt simultaneously.
The actor's problem is distinct from the throughput problem. Fear requires anticipation — a period of uncertain, unresolved tension before the strike. Toward a Model of Tension and Suspense (PMC) shows that compressing tension cycles collapses the emotional response. When a second group enters a scare chamber 12 seconds after the first, the actor cannot complete their performance arc. They either hold position and lose the first group's exit beat or strike early and lose the build-up. Both outcomes produce flat scares and negative reviews.
The gap between 500 and 600 tickets per night is where operators discover they cannot simply hire more actors or add a fog machine. They need a flow model. America Haunts Industry Facts notes that fewer than 3% of attractions ever exceed 35,000 annual guests — the ceiling that 600+ tickets per night implies. Those who do reach it consistently have systems for managing density, not just headcount.
The Pressurized-Pipe Model for High-Volume Scaling
Think of your haunt as a pressurized water system. At 400 tickets, pressure in the pipes is manageable — flow reaches each chamber at the right rate, actors reset between groups, and fear state builds cleanly. At 600+ tickets, you've increased inlet pressure faster than the pipe diameter can accommodate. The result is not more throughput — it's turbulence: groups pile up at Clown Alley, backflow into the transition corridor, and actors who were calibrated for 90-second reset windows now face 40-second windows with full tanks still in front of them.
Scaling a haunt beyond 600 tickets requires identifying three pipe diameters before opening night: corridor capacity, scare chamber reset time, and spawn interval. Each behaves differently under pressure.
Corridor capacity is your narrowest pipe. A 6-foot hallway at 500 guests per night carries 8 groups through per hour at comfortable spacing. Add 20% more tickets and the effective group spacing drops from 45 seconds to 32 seconds — not because you changed the interval setting, but because earlier groups slow down at decision points, compressing the buffer behind them. PressurePath's density mapping layer shows exactly where this compression occurs, so you can widen the virtual pipe by redesigning transitions before you discover the problem at 9:00 PM on opening weekend.
Scare chamber reset time is the pressure valve. A Butcher Room actor with a jump-and-retreat performance needs at minimum 8 seconds of group exit time plus 12 seconds of reset, or scares degrade into reactionary flailing. When you model 600 tickets through that room, you're asking the actor to perform 85+ distinct scares across a four-hour peak window. Without flow-aware scene design, actor fatigue compounds the density problem — by hour three, a tired actor with a short reset window is neither physically nor psychologically in their scare state.
Spawn interval is where the system either holds or breaks. Crowded and Popular: Theme-Park Experience (PMC) shows that perceived crowding degrades satisfaction independently of wait time — guests who feel jammed together report worse experiences even when throughput metrics look fine. PressurePath's spawn interval simulation lets you test whether your target ticket count produces perceived crowding at any given pinch-point, not just theoretical flow-rate overload.
The solution framework for 600+ ticket scaling rests on four adjustments run in simulation before you commit to a ticket count. First, map every scare chamber's minimum reset window against the proposed spawn interval — if any chamber cannot complete its beat cycle, the path needs a buffer room inserted. Second, identify every corridor segment where density will exceed 2.0 persons per square meter at peak; widen or stagger those segments in the model before construction.
Third, calculate the cumulative actor fatigue load across your 20-actor roster for a four-hour peak window at 600 tickets — the labor budget follows the flow model, not the other way around. Fourth, model the fire marshal density threshold separately from your scare-delivery threshold. The fire marshal cares about aggregate bodies per square foot; your scare delivery cares about group spacing in front of each actor. Both thresholds matter, and they are not the same number.
The 2024 Haunt Industry Report (HauntPay) found that 67.3% of haunts rely on ticket sales for 76–100% of their revenue. For those operators, overselling by even 15% in a single peak weekend can trigger the negative review spiral that haunts spend the other 11 months of the year trying to prevent. The pressure to maximize tickets per night is real — but the model has to precede the ticket count, not follow it.
For a deeper look at how these numbers play out across an entire season, 40 peak nights of haunt breaking-point data documents where specific density thresholds caused scare delivery to collapse. And if the revenue mechanics of where to set the cap feel unclear, ticket cap economics breaks down why pacing optimization returns more per head than volume restriction alone.
Advanced Tactics for Sustained Scare Quality at Scale
Once the simulation model validates your ticket count, three operational tactics keep scare delivery intact through a full peak-night season.
Variable spawn intervals by zone. Not all zones of your haunt have equal reset sensitivity. A fog corridor with ambient audio and no performer can absorb 30-second group intervals. The Butcher Room with a reactive actor needs 55 seconds. Running a flat spawn interval across the entire haunt optimizes for the average and destroys the extremes. PressurePath's zone-specific interval settings let you assign different spawn windows by chamber, so high-sensitivity scare rooms get protected spacing while low-sensitivity transitions absorb the surplus.
Peak-night pressure monitoring. The worst failures happen not on average nights but on the final Saturday of October when ticket demand spikes and staff are already fatigued from three weeks of operation. Building a real-time density alert threshold — triggered when any zone exceeds 90% of its modeled maximum — gives your queue management team 8–12 minutes of lead time to open a secondary holding area or slow the spawn interval before the jam hits the scare chambers.
Actor rotation against density cycles. At 600+ tickets, actor fatigue is a flow problem, not just a labor problem. Modeling your density peaks hour-by-hour reveals that most haunts have a 45-minute window between 8:30 and 9:15 PM where density and performance demands spike simultaneously. Scheduling actor rotations to pull performers for 8-minute breaks before that window — rather than on a flat 90-minute cycle — preserves the freshness of the performance during your highest-stakes scare window.
For broader context on how scaling challenges appear in other high-attendance immersive formats, scaling 80 to 400 in immersive theater productions covers parallel density mechanics in non-horror walk-through formats that share the same corridor physics.
What Operators Who Have Crossed 600 Tickets Got Right
The small percentage of haunts that consistently run above 600 tickets per night without scare delivery failures share three operational characteristics that are visible in flow data. First, they built their first flow model before they ever hit 500 tickets — not in response to a complaint spike, but as part of annual season planning. That habit means their models are calibrated to multiple seasons of actual guest behavior, not just theoretical geometry.
Second, they treat the spawn interval as a first-class operational variable rather than an informal practice. Their gate staff knows the specific interval floor for the current night's ticket count, and deviations from that floor are logged rather than absorbed into informal adjustment. That logging creates the dataset that allows the model to improve each year.
Third, they pre-position buffer capacity. The question they ask before setting next season's ticket count is not "how many tickets can we sell?" but "how many tickets can we sell without triggering our Clown Alley actor's 38-second collapse threshold?" Those are different numbers, and the operators who thrive at 600+ tickets know both.
A fourth characteristic is less visible but equally important: they document their breaking points as operational data, not anecdote. When the Butcher Room actor reports a collapsed reset window at 9:17 PM on October 22nd at 612 tickets, that data point goes into the same file as every other breaking-point observation from the season. Over three seasons, that file becomes a proprietary dataset calibrated to their specific haunt, and the dispatch schedule built from it outperforms any generic pacing benchmark. The haunts running 650-700 tickets per night with clean scare delivery are running against their own historical data, not against industry averages.
Ready to Model Your 600-Ticket Ceiling?
Every haunted attraction scales until the slowest room says no. That room is usually not the one the operator expects — it is a decompression zone that was adequate at 450 tickets and undersized at 620, or a corridor bend that absorbed compression at 480 and generated backflow at 580. The 600-ticket ceiling is not a universal number; it is the point where your specific haunt's narrowest pipe reaches its maximum working pressure. Finding that number requires running the full room-by-room pressure simulation at the target ticket count, at the actual batch composition you plan to sell, and at the peak-night arrival distribution your ticketing system will produce.
The simulation output is a specific answer: your haunt caps out at 587 or 634 or 712 tickets depending on the specific geometry and dispatch configuration. That number is defensible to investors, defensible to a fire marshal, and defensible to a marketing team pushing for higher volume. Operators who run the simulation arrive at the ticket cap conversation with a quantitative answer. Operators who guess arrive at the same conversation with instinct — and the marketing team wins.
PressurePath gives haunt designers the density simulation layer that makes 600+ ticket nights survivable without sacrificing the scare delivery your designers spent months perfecting. You set the target ticket count; the simulator shows where your pipe bursts before October does. Join the waitlist for haunted attraction designers at PressurePath and get early access to the spawn interval and density mapping modules before your next season's tickets go on sale.