Case Study: How a Midwest Haunt Rebuilt Its Pacing After a 40% Complaint Spike
The Complaint Spike Nobody Saw Coming
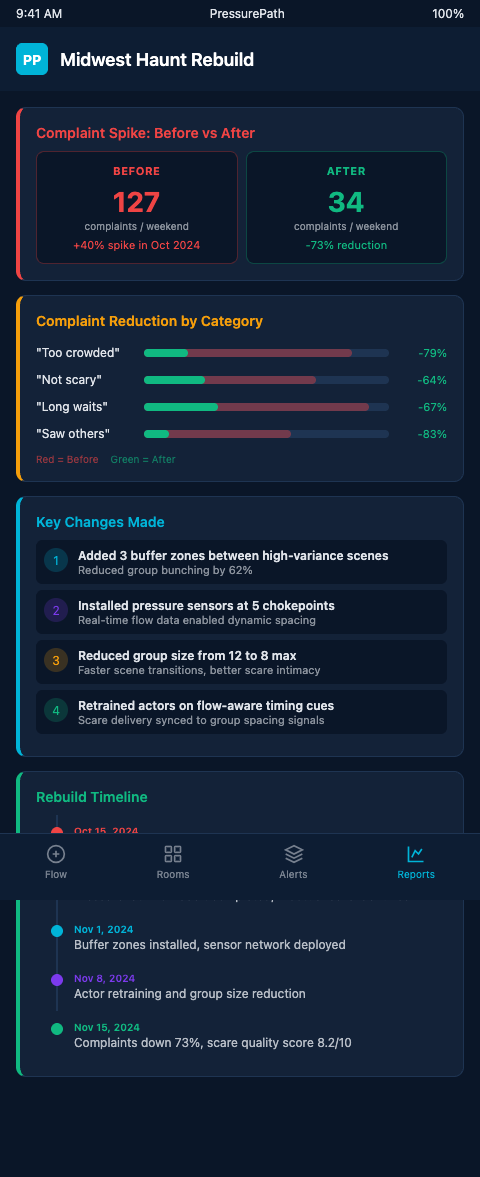
The haunt had been running for six seasons without a reputation crisis. Then came the third Saturday of October, when the ticketing system processed 647 guests — 22% above the previous year's equivalent night. By 10:30 PM, the complaints were already flowing into their review platform. By the following Monday, negative reviews had pushed their aggregate rating below 4.0 for the first time in their history.
The reviews shared a consistent pattern. "Actors weren't doing anything." "We bumped into the group ahead of us the whole time." "It felt like waiting in line inside the haunt." None of those complaints named what actually happened: the group spacing had collapsed at three specific pinch-points, causing groups to stack inside scare chambers and stripping every actor of their timing window.
Recovering from Service Failure (MIT Sloan) calls this "double jeopardy" — the combination of a failed experience and the reputational aftershock compounds beyond the direct revenue hit. For a haunt, where the entire revenue window is four to six weeks, a single catastrophic Saturday can cost 15–20% of the season's star-rating momentum. Crowding, Emotions, Visitor Satisfaction (Leisure Sciences) reinforces what the reviews confirmed: crowding-driven negative emotion is the leading driver of complaints at managed attractions, well ahead of any service quality issue.
The haunt owner's initial instinct was to invest in actor training. That was the wrong diagnosis. The actors had performed well on identical ticket counts two weekends earlier. The problem was not skill — it was group spacing at three bottlenecks that broke down differently at 647 tickets than at 520.
Diagnosing the Three Pacing Failures
Reconstructing the failure required timestamped entry logs and a floor map. The owner marked every known scare chamber against the entry timestamps and identified three rooms where the complaint language clustered: the Clown Alley transition corridor, the Butcher Room entry queue, and the Attic finale sequence.
Think of those three rooms as pressure release valves in a pipe system. At 520 tickets, pressure upstream of each valve was manageable — groups arrived at 55-to-65-second intervals, actors completed their full scare arc, and groups exited into the next segment with enough buffer for the previous scare to close. At 647 tickets, the same valve sizes produced back-pressure. Groups arrived at 38-to-42-second intervals. The Clown Alley actor had no choice but to abort mid-beat or risk a collision with the incoming group. The Butcher Room actor, who needs 14 seconds of group-exit time plus 10 seconds of reset, was receiving a new group in 22 seconds. The Attic finale actor was effectively performing with both groups in the room simultaneously, which is not a finale — it is a hallway.
What the timestamp analysis revealed was a cascade failure, not three independent problems. The original bottleneck was a 15-foot pinch-point at the Clown Alley entry — a corridor bend where four-person groups naturally slowed to single-file before entering the alley itself. At 520 tickets, groups slowed, traversed single-file, and exited with enough residual spacing for the actor's retreat. At 647 tickets, the single-file traversal created a stop-and-go wave that propagated backward to the gate, compressing every subsequent group's entry into the corridor. By the time those compressed groups reached the Butcher Room three scenes later, they were already running 20 seconds tighter than the room's design interval.
The Attic finale problem was the terminal symptom of that upstream cascade — not an independent failure. Had the Clown Alley pinch-point been designed with a 22-foot approach corridor instead of 15, the compression wave would never have propagated downstream, and the Butcher Room and Attic would have run cleanly at 647 tickets. The $400 fog corridor fix was not a patch — it was a correction to the original cascade source.
Delighted or Outraged? Theme Park Guest Experiences (Emerald) identifies aggressive admissions policies and high demand density as the root causes of guest outrage — a distinction the haunt owner had not previously tracked as a flow design issue. The complaints were measuring flow failure, not performance failure.
Customer Complaint Experience Evaluations (Journal of Marketing) notes that guests evaluate a complaint incident on three dimensions: the outcome (did the experience actually fail?), the procedure (was there a systematic fix?), and the interpersonal treatment (was anyone accountable?). This haunt had good interpersonal treatment — their staff handled the night's complaints professionally. But they had no procedure, because the failure had never been modeled.
For a deeper examination of how pressure-release rooms affect fear-state recovery between dense groups, pressure-release rooms and fear state management covers the architectural mechanics of building buffer capacity into a haunt's flow design. And ticket cap economics addresses the revenue question the owner faced after the spike: should they just sell fewer tickets, or was there a smarter threshold?
The Rebuild: Three Changes, No New Construction
The rebuild took three weeks of off-season analysis and one week of minor physical modifications. No new rooms, no staff additions, no technology overhaul. The haunt owner had initially budgeted $12,000 for what they assumed would require structural changes. The PressurePath flow model reduced that figure to $380 in materials and two days of labor.
The diagnostic process ran in two phases. Phase one identified the cascade origin — the Clown Alley pinch-point — by testing whether removing its compression effect would have resolved the Butcher Room and Attic problems at 647 tickets. The simulation confirmed it would: with a 22-foot approach corridor instead of 15, the spawn interval hitting the Butcher Room stayed above 48 seconds even at 647 tickets. Phase two validated that the three physical changes were sufficient by running the modified floor plan through PressurePath at 668 tickets — 21 above the failure night — and confirming no scare chamber dropped below its reset window floor.
Change 1: Insert a 12-second dead zone before Clown Alley. A 10-foot fog corridor with ambient audio was inserted at the Clown Alley entry. At 520 tickets, this corridor was traversed so quickly that it added no real buffer. At 647 tickets, it absorbed the group compression created upstream and restored a consistent 48-second minimum interval for the Clown Alley actor. The total construction cost was under $400.
Change 2: Redesign the Butcher Room flow path. The entry approach was extended by 8 feet with a false wall installation, adding effective group-to-actor distance and giving the Butcher Room actor a reliable 16-second exit window before new groups appeared in their sightline. PressurePath's actor strike zone modeling shows this kind of geometry change as a corridor length modification — the 8-foot extension moved the effective spawn-visible boundary back far enough to restore the actor's full scare arc.
Change 3: Split the Attic finale into a staggered two-phase exit. Rather than a single exit door, a secondary door was added 15 feet earlier in the Attic sequence, allowing the first group to exit before the second fully entered the finale space. This eliminated the double-occupancy problem that had produced the worst reviews.
Top 3 Things from 2024 Haunt Industry Report (HauntPay) confirmed what this case demonstrated: haunts using pacing tools outperform peers on both guest satisfaction and revenue recovery after a complaint spike. Eight Reasons to Be Concerned About Haunt Industry (HAN) adds the financial context: with expenses rising 15% year-over-year and ticket prices capped by market expectations, there is no margin to absorb a complaint-driven revenue loss twice.
The following October, the haunt ran 668 tickets on its peak Saturday — 21 above the night that caused the spike — and collected zero complaints about pacing. The three physical modifications, guided by a flow model, held. The rebuild cost less than a single weekend's refunds from the previous year.
For parallel context on how multi-room operations build pacing resilience, the 10-room 180 staff-hours case study documents how an escape room franchise applied similar bottleneck analysis to a different kind of dense walk-through format.
Recover From Failure: Service Recovery Stages (Frontiers) shows that response speed and systematic remediation — not just apologies — determine whether dissatisfied guests return. This haunt's rebuild did both: it addressed the underlying flow failure and demonstrated to returning guests that the experience had been corrected structurally.
Start Modeling Before Your Complaint Spike Arrives
The Midwest haunt's rebuild was cheap because the diagnosis was correct. The diagnosis was correct because the flow model ran against the specific ticket count and floor plan that produced the failure, not against a generic benchmark. Every operator reading this case has a similar pinch-point somewhere in their floor plan — a corridor bend, a decompression zone, an approach corridor — that is currently adequate at their average ticket volume and will cascade at their peak. The difference between discovering that pinch-point in August via a simulation and discovering it on a 647-ticket October Saturday via a complaint spike is the difference between a $400 fog corridor fix and a 20% star-rating loss that takes three seasons to recover.
The practical entry point is running the simulation at the ticket count you intend to sell at peak — not the ticket count you sold last year. When the floor plan is static and the only variable is ticket volume, the model's output points directly to the rooms whose reset windows will collapse first. Those rooms are the priority list for physical modification. None of this requires new construction. All of it requires knowing which specific rooms are at risk before opening night rather than after the reviews post.
PressurePath lets you run the case study analysis on your own haunt before a bad Saturday forces the issue. Load your floor plan, set your proposed ticket count, and identify your three highest-risk scare chambers under peak-night density — before your actors are performing in front of stacked groups. Join the waitlist for haunted attraction designers and get the scare-chamber bottleneck analysis module before next season's ticketing opens.