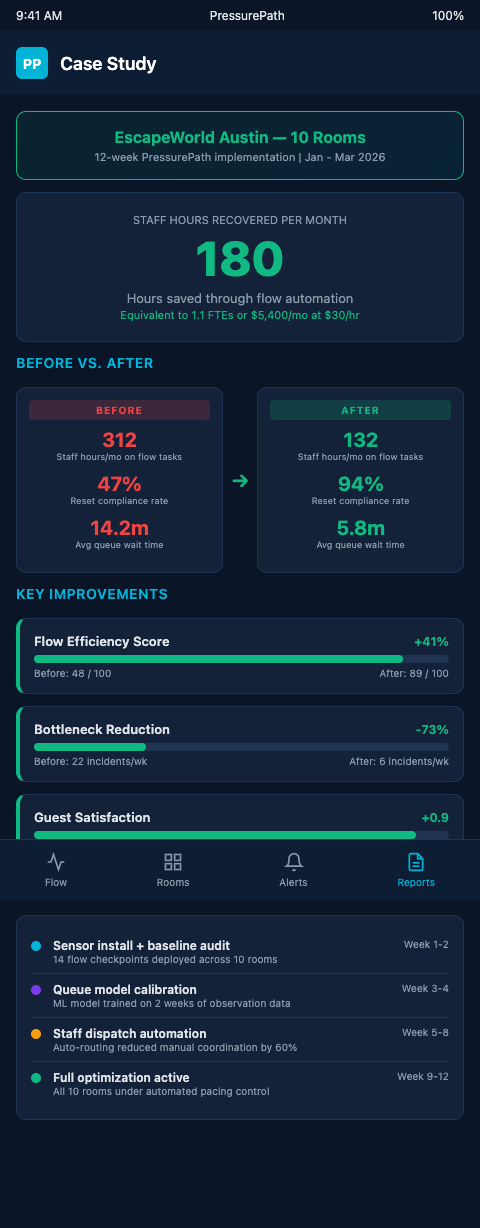
Case Study: How a 10-Room Franchise Recovered 180 Staff Hours Per Month
The Problem Hiding in Plain Sight
Before the franchise owner ran a pacing simulation, the operation looked functional. Rooms filled on Saturdays, guests left satisfied, and the review scores stayed respectable. The inefficiency was invisible in the guest experience but very visible in the payroll reports.
A closer look at three months of shift logs found a consistent pattern: Game Masters were clocking double-coverage during transitions between rooms 5-8 and spending 12-15 unscheduled minutes per shift managing briefing room overflow. Reset station staff were completing rooms out of sequence, adding 6-8 minutes per reset because they were reacting to exits rather than anticipating them. The photo op was creating a secondary queue that GM staff were managing manually, drawing them away from their scheduled positions. None of these were dramatic failures — each felt like a minor operational wrinkle. Combined across two Saturday shifts and two Sunday shifts, they added up to 180 billable staff hours per month being spent on coordination friction rather than guest service.
State of the Escape Room Industry Report 2024 identifies last-minute bookings and staffing as top operational challenges for escape room owners — confirming this pattern isn't isolated. The owner in this case assumed the problem was booking unpredictability. The actual problem was a pacing model that treated every shift identically, regardless of which rooms were running and in what sequence.
Mapping the Flow to Find the Waste
The pacing model PressurePath built for this franchise started with the Saturday booking grid — specifically the 2 PM to 6 PM window, where six of ten rooms ran consecutive 60-minute sessions with 15-minute resets. When the simulator ran that grid as a pipe network, three junctions showed immediate pressure buildup.
The briefing room was the first. With rooms 3, 5, and 7 all completing sessions within a 9-minute window, three groups were queuing for the same 12-minute briefing cycle. The pipe diameter — one GM running briefings — couldn't handle the flow volume. The simulator flagged a 14-minute average briefing wait on Saturdays between 2 and 4 PM. That single bottleneck was responsible for the GM double-coverage entries in the shift logs.
The reset station was the second junction. The franchise had two reset staff for ten rooms. When rooms 5, 6, and 8 finished simultaneously — which the booking grid made possible every other Saturday — two reset staff were trying to cover three rooms. They prioritized by proximity, which meant Room 8 waited an average of 18 minutes. Every group booked into Room 8 after 2 PM experienced a delayed start.
Lean Manufacturing Waste Reduction (The Lean Way) classifies waiting and non-utilized talent as two of the eight lean wastes. Both applied here: guests waited for rooms that were ready but lacked a GM to brief them, and reset staff who had finished their assigned room were standing idle because no signal existed to redirect them.
The pressurized-water model made the fix intuitive. When too much fluid volume tries to pass through a narrow junction at once, you don't add pressure — you reroute flow upstream. The solution for this franchise wasn't more staff; it was changing when groups entered the pipe to prevent simultaneous arrivals at shared junctions.
Organizational Workflow and Work Quality (NCBI) documents the direct relationship between workflow inefficiency and staff rework hours — each coordination failure triggers compensating actions that consume time well beyond the original delay.
PressurePath's simulation showed the fix in two steps: stagger room start times so no three rooms finish within a 9-minute window, and assign reset station priorities before shift start based on the day's booking order. The first change required adjusting the Saturday booking grid by 7 minutes per room pair. The second required a pre-shift briefing printout showing reset sequence and projected completion times by room.
Digital Scheduling Reduces Overtime 30-50% (myshyft.com) reports that healthcare organizations cut overtime 41% in year one by aligning schedules to historical demand patterns — the same logic applied here with flow-driven scheduling rather than static shift assignments. Process Optimization in Hospital Environments (ScienceDirect) confirms the mechanism in high-throughput service environments: systematic workflow review yields measurable staff-hour recovery when handoff sequences between parallel capacity units are optimized rather than left to reactive improvisation.
The staff dashboard alerts that GMs were using during peak hours had real-time data but no predictive layer. Staff reacted to what was already backed up rather than seeing what was about to arrive at the junction. Adding the simulation layer meant GMs knew at 1:45 PM which rooms would exit simultaneously at 2:10 PM — and could pre-position rather than scramble.
What the 180 Hours Actually Represent
The recovered hours broke down as follows across an average month: 72 hours from eliminating briefing room double-coverage (one GM removed from the 2-4 PM Saturday overlap); 58 hours from resetting rooms in priority sequence rather than by proximity; 50 hours from photo op management being handled by the exiting group's natural movement through the corridor rather than requiring a dedicated GM redirect.
Those hours aren't just cost savings — they're redeployable capacity. The franchise redirected 40 of the 180 hours to proactive guest engagement during session intervals, which the owner reported improved review scores noticeably within six weeks. The remaining 140 hours came directly off the monthly labor cost.
Workforce Scheduling Optimization (MCP Analytics) reports that top-quartile scheduling organizations achieve 18-28% lower labor cost per unit of output through demand-aligned scheduling. This franchise achieved the lower end of that range in month two after implementing the simulation-derived schedule.
The lesson for buffer capacity economics is direct: excess staff coverage during peak hours looked like a buffer — a safety margin against uncertainty. It was actually a tax on a broken pacing model. The real buffer wasn't headcount; it was the 7-minute stagger built into the booking grid.
Operators looking at similar patterns can use this case study as a baseline. The museum bypass case study from a children's museum environment found comparable gains from upstream flow intervention — validating that the pattern of recovering labor hours by fixing sequencing holds across different venue types and visitor contexts.
Start With One Shift, One Day
Running the full simulation for all ten rooms across a month of Saturdays sounds like a large project. It isn't. The fastest path to quantifying your own version of this inefficiency is to pull three months of shift logs, identify the transitions where staff logged unexpected overlap or extended coverage, and run just those transitions through PressurePath as a pipe segment.
Most franchises discover their biggest pacing leak within the first Saturday simulation pass. The owner in this case study found it in the 2 PM slot on the first run. That single finding — briefing room pressure building from three simultaneous exits — drove most of the 180-hour recovery.
PressurePath is built for this kind of targeted diagnostic, not a full operational overhaul. You don't need to re-engineer the entire franchise before your next busy weekend. You need to find the one junction where pressure is building and reroute the flow before it backs up into your Saturday booking grid.
The 180 hours recovered in this case study came from three specific changes: a 7-minute stagger in the Saturday booking grid, a pre-shift reset sequence printout, and a photo op timing cue. Each was free to implement once the simulation identified it. None required hiring, capital, or operational downtime.
If your franchise has more than six rooms and runs above 70% utilization on Saturdays, the flow pattern described in this case study almost certainly exists in your operation. The question is whether you've measured it. Pull three months of shift logs, look for the unplanned GM overlaps and extended reset entries, and bring those timestamps to your first PressurePath simulation run. The model will tell you which junction is creating them — and what a resequenced booking grid does to eliminate them before your next busy season begins.
Workforce Scheduling Optimization (MCP Analytics) reports that top-quartile scheduling organizations achieve 18-28% lower labor cost per unit of output — the franchise in this case study landed in that range by making one structural change to their booking grid and one pre-shift protocol change. Neither required new hiring, new infrastructure, or training beyond a 20-minute pre-shift briefing update. The operational change was free; the simulation that identified it was the only investment required.
Most 10-room franchises have between 120 and 180 unplanned staff hours per month hiding in their shift logs. Some of those hours are unavoidable — genuine uncertainty that no model can fully anticipate. But at least half are predictable from the booking grid, and predictable waste is preventable waste. PressurePath exists to close that gap — and the closing starts with a single simulation run against your last month of Saturday data.