Building Staff Dashboards That Surface Traffic Jams Early
The Information Gap That Turns Saturdays Into Firefighting Shifts
Organizations with real-time alerting see 60–80% reduction in incident impact, according to Kentik's research on network monitoring alerts. In network operations, that alert arrives before the bottleneck compounds. In most escape room franchises, the equivalent alert is a GM noticing that the briefing room has three groups queuing simultaneously — which means the bottleneck has already formed.
The information gap isn't a staffing problem. It's a visibility problem. A 10-room franchise on a peak Saturday generates a continuous stream of flow data: room exit times, briefing room occupancy, reset station status, photo wall queue length. That data exists in the physical world — GMs observe it — but it isn't aggregated, timestamped, or threshold-monitored in a way that produces early warnings.
SCADA architecture, as defined by PTC, collects telemetry from field devices and converts it into visual alerts and operational dashboards. The architecture maps directly onto what a multi-room GM-station alert infrastructure requires: sensors (or manual inputs) for each room, a central aggregation layer, and threshold-triggered alerts that fire before the bottleneck becomes a guest complaint. Without the alert layer, every traffic jam is discovered at the moment of impact.
Designing Dashboards That Show the Right Signals
The goal of a staff dashboard for a multi-room franchise isn't to display all available data — it's to surface the three or four signals that predict a traffic jam before it forms. ACME Automation's documentation on SCADA dashboards describes converting real-time operational data into visual alarms that frontline teams can act on without analysis. The same principle applies to a GM operations dashboard: if a staff member has to interpret a table of numbers to know whether the briefing room is about to overflow, the dashboard has failed its purpose.
The four signals that matter most for escape room traffic jam prediction:
Briefing room pressure index: How many groups are projected to exit parallel rooms within the next 20 minutes? If the answer exceeds briefing room capacity by more than one cohort, the alert fires.
Reset station lag: Is the current reset cycle running more than 4 minutes behind the projected exit time for the next incoming group? A 4-minute lag at 2:45 PM becomes an 8-minute lag by 3:30 PM if it's not caught early.
Photo wall queue accumulation: Has photo wall dwell time exceeded 90 seconds per group for two consecutive cohorts? That's the leading indicator for the 9-minute backup that your Saturday scenario produces.
Parallel room domino risk: Are rooms 4, 6, and 8 — three that share a downstream reset corridor — all running within 5 minutes of simultaneous completion?
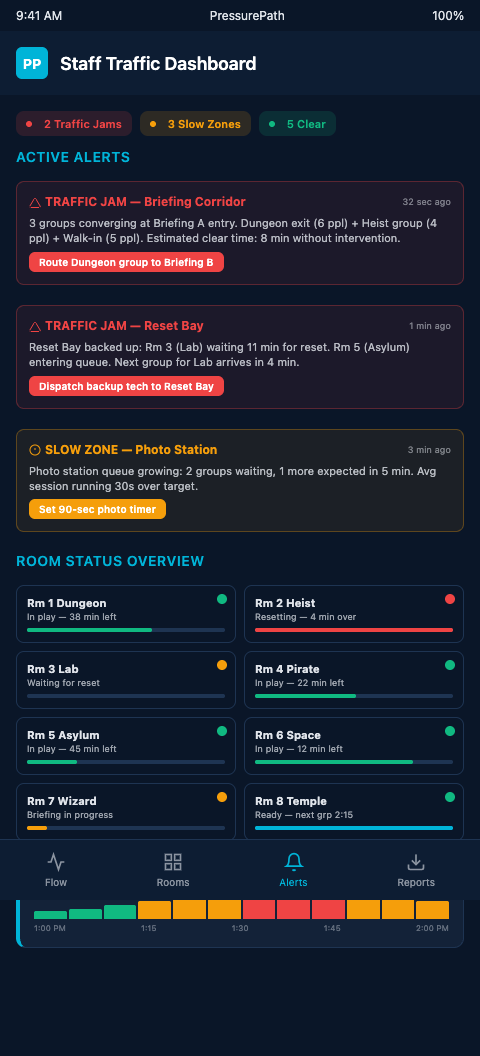
Think of the dashboard as a pressure gauge on the pipe network. PressurePath models these four signals from your booking grid and room configuration, and the dashboard displays them as color-coded pressure readings: green (safe), amber (monitor), red (intervene). When the briefing room pressure index goes amber at 2:30 PM, the GM has 15 minutes to redistribute — not 90 seconds to explain a refund.
A 10-room franchise running 75% Saturday utilization typically sees its dashboard cycle through 6-9 amber events across an 8-hour shift, each lasting 8-14 minutes from first warning to resolution. Without early warning, those same events register on the GM's radar only after they've already hit red — adding 4-6 minutes of cascade time to each before staff can respond. Across a peak month of four Saturdays, the gap between amber detection and red-state response represents roughly 90-140 minutes of avoidable queue pressure, most of which shows up as unplanned staff reassignments and briefing room overflow.
The dashboard doesn't reduce the number of pressure events — the structural booking grid determines that number — but it collapses the response window from reactive to anticipatory, which is the operational difference between firefighting and flow control. Anticipatory response at a 10-room franchise typically costs 2-3 minutes of GM attention per event, versus 12-18 minutes of reactive redeployment when the same event hits red without warning.
For flow control tools that extend beyond dashboards into automated alerts and booking adjustments, the dashboard layer is the prerequisite — you can't automate an alert for a signal you haven't defined.
Cascade's framework for operational KPIs confirms that operational dashboards for frontline teams must focus on live metrics tied to time-sensitive tasks. The escape room equivalent: the briefing room pressure index must update in real time, not at end-of-shift when it's too late to act.
Making Dashboards Actionable for Multi-Location Franchises
A single-location dashboard answers "what's happening right now?" A multi-location franchise dashboard answers "which of my three locations is about to have a problem?" FranConnect's research on multi-location operations software shows that cross-site visibility is the primary value driver for franchise operators investing in operations technology.
For a franchise with three locations, the central operations dashboard should show the briefing room pressure index and reset station lag for all three simultaneously. When the Orlando location goes amber at 2:30 PM while the Tampa location is green, the operations director knows where to focus attention. Without cross-location visibility, each location manages its own fires independently.
The staff hour firefighting problem that costs multi-room franchises hours of unproductive labor every peak weekend is largely a downstream consequence of this visibility gap. Staff firefight because they don't see the pressure building until it's already a fire.
Tulip's documentation on manufacturing shop-floor dashboards shows that shop floors with real-time bottleneck visibility reduce unplanned downtime by surfacing constraint stations before the cascade begins. The escape room parallel is exact: the briefing room is the constraint station, and the dashboard's job is to show it going amber before it goes red.
For operators running multiple game rooms, educator-style dashboards that track bypass patterns offer a useful design reference — specifically how to make flow anomalies visually distinct from normal operation without overwhelming frontline staff with noise.
IoT-enabled real-time alert systems research from PMC documents that threshold-based notification models — where alerts fire when a metric crosses a defined boundary rather than on a polling schedule — cut response time most dramatically. For escape rooms, the practical implementation is a simple threshold rule set: if briefing room pressure index exceeds 2.0 concurrent groups for more than 10 minutes, send a Slack message to the GM on shift.
The Shift From Reactive to Anticipatory Operations
Multi-room escape room franchise operators building staff dashboards for the first time face a sequencing question: what do you measure before you invest in alerting infrastructure? The answer is the briefing room pressure index and reset station lag — both can be tracked with manual timestamping or a simple shared spreadsheet before investing in integrated tooling. PressurePath generates the pressure forecasts from your booking grid, so the alert inputs are available before you've built the alert infrastructure.
Even a basic Friday review that surfaces three or four amber windows for the coming Saturday gives the GM team more lead time than any amount of in-shift hustle can recover. Start with a Friday pre-shift review of PressurePath's Saturday pressure map, assign a GM to monitor the amber signals, and build toward automated alerting as your data confidence grows. If your franchise currently runs peak Saturdays without any traffic jam early warning system, join the waitlist — the simulation output is your first operations dashboard.