How to Prevent Safety Throttles From Capping Your Ticket Count
The $40,000 Saturday Night That Never Happened
A well-run haunted attraction with 600 tickets sold for peak Saturday and a 3-hour window expects to clear revenue that represents a meaningful fraction of its entire October earnings. When the fire marshal walks in at 8:15 PM and issues a density throttle that reduces entry rate to 200 per hour, two-thirds of that night's ticketed guests wait in a queue that is moving at one-third speed. Some leave. Those who enter are angry. Reviews the next day say "disorganized" and "terrible wait times." None of the reviews say "we found out the bottleneck is an undersized corridor at Chamber 4."
Revenue capped across only a handful of peak weekends is the industry's financial reality — and a fire marshal ticket cap on any one of those nights destroys margins that were already thin. The frightening economics of haunted houses are built around a revenue window so compressed that a single throttled night can eliminate the season's profit.
NFPA 1 classifies haunted houses as special amusement buildings with defined occupant load limits derived from floor area and use type. Failure to meet sprinkler, egress, or occupancy requirements triggers enforcement that ranges from reduced occupancy to full shutdown. The throttle is not punitive. It is mechanical — the code has a number, your in-attraction count exceeded it, and the consequence is mandatory.
What is preventable is not the code limit itself but the gap between the code limit and your flow model. Most haunted attraction designers know their legal occupant load number. Very few have run that number through a dynamic pressure simulation to understand which specific chamber, at which specific point in the night, will cause the in-attraction count to breach the limit.
Designing Out the Safety Throttle: The Pressure Model Approach
Your haunt's capacity is not a single number — it is a function of flow. The legal occupant load per NFPA 101 sets the ceiling for total in-attraction guests at any moment. Your actual density at any moment depends on walk-through velocity, dispatch interval, and arrival rate. When those three variables combine to push in-attraction count above the ceiling, a safety throttle is the result.
The pressurized-fluid model makes this concrete. Your entry gate is the pump. Your ticket sales by time slot set the flow rate into the pipe. Your corridors and chambers are the pipe segments. The occupant load limit is the pressure rating of the pipe — exceed it and the regulator cuts flow.
A queue management throughput model shows exactly what happens when spacing stations raise density within a chamber without triggering global occupant load limits: by increasing walk-through velocity, you reduce the average dwell time per guest, which reduces the average in-attraction count at any moment, which creates headroom between your actual occupancy and your legal ceiling. The throttle becomes preventable not by selling fewer tickets but by moving guests through faster without degrading the scare experience.
The practical levers are chamber design, dispatch interval, and corridor geometry — and their combined effect on walk-through velocity. Consider a haunt with a 12-minute average walk-through time and a 90-second dispatch interval. At that cadence, the in-attraction count at steady state is 8 groups × average group size = approximately 64 people in the attraction simultaneously. If your occupant load limit is 80, you have 16 people of headroom. That sounds comfortable until your peak-night arrival cluster compresses 120 guests through the gate in 20 minutes — and walk-through velocity drops by 30% under the increased density. Suddenly the in-attraction count is 90 and the fire marshal's meter is reading above the limit.
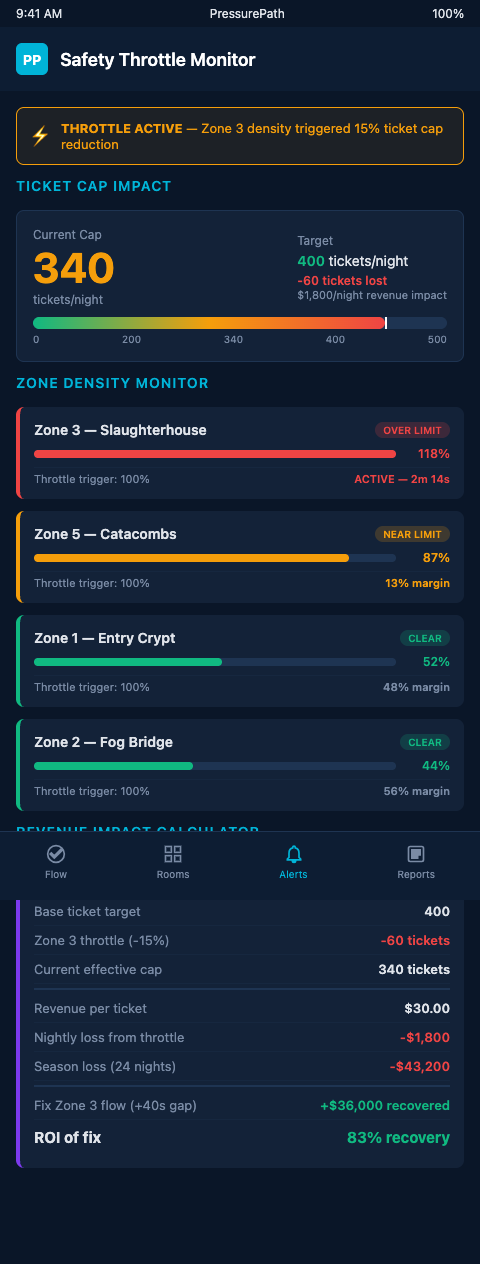
PressurePath simulates this scenario before opening night. The model takes your chamber dimensions, corridor geometry, dispatch interval, and ticket sales by time slot and produces an in-attraction count forecast per minute across your peak night. The throttle threshold is overlaid directly on that forecast — you see the exact time when count will exceed the limit and the exact upstream condition driving it.
Safety inspection flow data from prior seasons gives designers the empirical basis for calibrating these simulations — real walk-through velocity under real density conditions is consistently different from the estimates that most opening-night plans use, and closing that gap is where throttle prevention actually happens.
State-level fire code interpretations vary substantially. Texas AHJ guidance, for instance, reflects local code interpretation that determines whether a specific scare chamber layout triggers a higher occupant load classification. Running your pressure model against multiple code interpretations — the strictest and the median — gives you a defensible range and ensures you are not building your dispatch schedule around an optimistic code reading.
Advanced Tactics: Raising Capacity Within the Safety Limit
Throttle prevention is not just about staying below the ceiling — it is about getting as close to the ceiling as possible, consistently, across every peak night. These tactics work together to maximize revenue while preventing enforcement.
Walk-through velocity optimization. Identify your two slowest chambers — the ones where guests consistently linger, where the experience design creates dwell time beyond what the scare itself requires. Measure actual dwell time under peak-density conditions versus low-density conditions. For chambers where dwell time is design-driven (intentional immersive elements), accept the dwell and adjust dispatch accordingly. For chambers where dwell time is friction-driven (unclear exit path, poor lighting leading to hesitation, confusing transitions), remove the friction. A 45-second reduction in average walk-through time across your attraction, applied to your peak-night dispatch model, may create 12-15 additional people of headroom against your occupant load limit.
Pre-season fire code review with flow model in hand. Schedule a non-inspection meeting with your local fire marshal or AHJ before your pre-opening inspection. Bring your occupant load calculation, your peak-night arrival distribution, and your dispatch interval schedule. Show the inspector how your model constrains in-attraction count below the legal ceiling at every hour of peak operation. Inspectors who see this preparation are more likely to work collaboratively on any marginal cases — a corridor width that is 2 inches below a threshold, a chamber occupancy that could be interpreted either way — rather than defaulting to the more restrictive reading. Proactive flow documentation is your best compliance tool.
Granular ticketing window management. The difference between a 600-ticket night that triggers a throttle and a 600-ticket night that does not is arrival distribution. If all 600 tickets are sold for three 20-minute entry windows, your arrival cluster is dangerous. If those same 600 tickets are spread across eight 15-minute entry windows with caps calculated from your flow model's LOS thresholds, you can sell the same number of tickets and never approach the occupant load ceiling at any moment.
Bottleneck removal audit. Run your pressure simulation on every corridor segment below 4.5 feet in width. Rank them by their contribution to in-attraction density accumulation during peak windows. Removing or widening the top three bottlenecks typically produces a larger reduction in peak occupancy than any dispatch interval adjustment can achieve.
Myth-busting walk-through capacity estimates. The capacity myths around walk-through times are a direct contributor to throttle exposure — designers who calibrate dispatch intervals based on low-load walk-through tests consistently oversell peak windows because their baseline velocity assumptions are wrong.
The throughput ceiling framework from escape room design applies directly to haunted attractions: your real capacity is set by the slowest room in your attraction, not by your average walk-through time, and identifying that constraint room is the first step in throttle-prevention capacity optimization.
Model the Limit Before the Marshal Measures It
A safety throttle is a data-sharing moment — the fire marshal's density meter is telling you something your flow model should have told you in September. Build the model before the inspection, not after the throttle.
The practical preparation sequence is straightforward: in August, build your flow model with your chamber dimensions and planned ticketing volumes. In early September, validate the model against your soft-open nights at escalating density. Before your fire marshal inspection in late September, bring your occupancy forecast and dispatch schedule to the meeting. Inspectors respond to documented flow management plans — not because they are required to accept them, but because a designer with a model has clearly thought through the density dynamics the code is protecting against.
The haunted attraction industry's revenue structure makes throttle prevention a financial priority that deserves the same planning rigor as set construction or actor rehearsal. Your entire October margin is generated across a handful of peak Friday and Saturday nights. Every preventable throttle on any one of those nights is a compounding loss — the direct ticket revenue, the queue experience damage, the review impact on future seasons.
PressurePath gives haunted attraction designers a peak-night occupancy forecast with chamber-level specificity, overlaid against your NFPA occupant load limit and your local code thresholds. You see the throttle risk before it materializes, and you have specific, actionable levers to remove it: corridor widths, dispatch intervals, ticketing window caps.
October's revenue window is too short and too valuable to lose a peak Saturday to enforcement. Model the pressure, protect the capacity, and sell every ticket you legitimately can — because the difference between a throttled night and a clean night is usually one corridor width and one dispatch interval adjustment that a flow model could have identified in August.