Why Your Walk-Through Times Lie About Real Capacity
The Number That Sets Everything Wrong
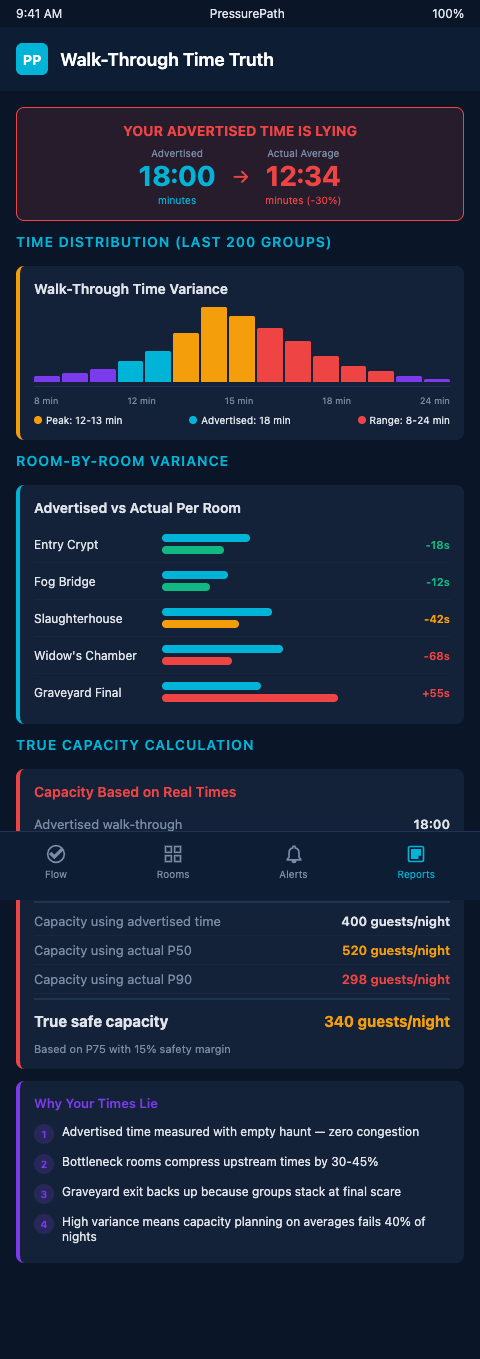
Most haunted attraction designers establish their dispatch interval the same way: walk through the attraction with a small staff group, time it, divide by desired group spacing, and set the dispatch interval. A 14-minute walk-through becomes a 2-minute dispatch interval to keep 7 groups in the attraction simultaneously. The math checks out. The capacity plan is built.
On peak Saturday, walk-through time is not 14 minutes. It is 19 minutes. And the dispatch interval, unchanged from the baseline measurement, is now sending groups in 36% faster than the attraction can push them through. Every chamber downstream of the first bottleneck is receiving groups before the previous group has cleared. Fear state collapses in Clown Alley by 9:15 PM. The fire marshal's density meter is already reading above threshold by 9:45.
The problem is not the dispatch interval. It is the baseline walk-through time that the dispatch interval was calculated from. That baseline was measured under conditions that bear no resemblance to peak Saturday — and the capacity plan built from it is structurally wrong before October 1st.
This is not an operator error. It is a measurement error that becomes an operational error. The industry-standard walk-through time test produces a number that is accurate for the conditions in which it was measured and completely misleading for the conditions in which it will be used. Understanding why — and what to measure instead — is the first step to accurate capacity planning.
Why Walk-Through Time Tests Lie: The Physics
The Fundamental Diagrams of Pedestrian Flow establish the core relationship: walking speed is not constant — it is a function of density. As crowd density increases, individual walking velocity decreases, and at high density, the decrease is non-linear. A 50% increase in density does not produce a 50% decrease in speed; it produces a much larger speed reduction because of interaction effects between individual movement paths.
Your baseline walk-through test was conducted at near-zero density. Six staff members walk at approximately 1.4-1.6 meters per second through your corridors. At peak Saturday density — which in active scare sections will reach Fruin LOS D or higher — the effective walking velocity in your corridors drops to 0.8-1.0 meters per second. That velocity reduction alone adds 4-6 minutes to your 14-minute baseline walk-through time.
But velocity is only the first distortion. The second is behavioral. At low density, your test group moved purposefully and continuously. At peak density, guests stop, cluster around scare actors, reach back for partners, hesitate at thresholds, and slow down to maintain social cohesion with their group. Your Clown Alley chamber adds 90 seconds of behavioral dwell at peak density that is invisible at baseline. The Butcher Room adds another 60 seconds. Across 8-10 chambers, the behavioral dwell adds 10-15 minutes to the physical velocity adjustment.
Little's Law — queue depth equals arrival rate multiplied by expected wait time — describes steady-state capacity. But the walk-through time it uses as an input is only valid at steady state. Peak nights are not steady state. Your arrival cluster in the first 90 minutes of peak operation produces an in-attraction count that exceeds the steady-state calculation by 30-40%, because arrivals are not distributed evenly — they surge. The walk-through time under those surge conditions is the number your capacity plan needs. Your baseline test cannot produce it.
Queue management research confirms the measurement gap directly: walk-through time under low-load test conditions underestimates real capacity by wide margins. AnyLogic pedestrian simulation can replicate peak-load density conditions that walk-through tests under quiet conditions cannot — because the simulation runs thousands of individual agent behaviors simultaneously, including the clustering and hesitation effects that are invisible in a six-person staff test.
Walk-through time tests mask pile-up dynamics entirely. An operator who times a 14-minute walk-through at baseline and observes that the attraction ran "fine" at low density has not tested for pile-ups — because pile-ups only emerge at the density thresholds that the baseline test does not approach. The test feels like a capacity validation. It is actually a capacity fiction.
PressurePath addresses this directly by modeling walk-through velocity as a density-dependent variable, not a fixed number. The simulation applies speed-flow-density relationships from pedestrian flow research to your specific corridor geometries and chamber configurations, producing a peak-night walk-through time estimate that reflects actual velocity under actual crowd conditions. That estimate becomes the input to your dispatch interval calculation — and the resulting dispatch interval reflects the real capacity ceiling of your attraction, not the theoretical one.
The haunted house industry standard suggests haunted attractions average 7,500-10,000 guests across a season. At that scale, a capacity calculation error of 15% translates into hundreds of misallocated dispatch intervals per operating night. The cumulative revenue loss from throttling, the cumulative scare failure from pile-ups, and the cumulative review damage from overcrowding all trace back to the 4-minute gap between baseline walk-through and real peak walk-through that the initial test never captured.
Operations management's bottleneck principle adds a final layer: process capacity equals the minimum throughput rate across all stations. Your real capacity is not your average walk-through time. It is your slowest chamber's throughput rate multiplied by the density correction factor for peak conditions. Your baseline test averages across all chambers. Your worst bottleneck under peak conditions sets the real ceiling.
That worst bottleneck is usually not obvious from a baseline walk-through. It is usually the second-narrowest corridor, or the chamber with the highest designed dwell time, or the actor position that requires the longest reset. The safety throttle prevention framework requires knowing which chamber hits the occupant load ceiling first — and the baseline walk-through test cannot tell you that.
Advanced Tactics: Measuring Real Capacity Before Opening Night
Getting to an accurate capacity number before opening night requires replacing the baseline walk-through test with a density-adjusted throughput measurement protocol.
Soft-open density test. Run your preview weekend with a deliberate escalating density protocol: first night at 40% capacity, second at 60%, third at 80%. At each density level, time the walk-through for 5 different groups using a staff observer with a stopwatch. Plot the walk-through time against density. The resulting curve gives you a density-adjusted walk-through function — the actual relationship between in-attraction count and walk-through time for your specific attraction geometry. Use this curve to calculate the dispatch interval that corresponds to each density level.
Bottleneck timing. Assign an observer to each of your three highest-suspicion bottleneck locations during your 60% and 80% soft-open nights. Time the chamber-to-chamber transit rate at that specific point — how many seconds between one group fully clearing the chamber and the next group's lead guest crossing the threshold. Compare this rate to your dispatch interval. If groups are consistently clearing 20+ seconds faster at 40% density than at 80% density, the bottleneck compound effect is real and your baseline test missed it.
Back-calculation from fire marshal math. Take your NFPA occupant load limit (floor area ÷ load factor), apply your density-adjusted walk-through function, and back-calculate the maximum sustainable dispatch interval at each density level. This gives you a compliance-safe dispatch schedule tied to real measured data rather than baseline estimates.
Velocity drop mapping by corridor segment. During your soft-open nights, assign an observer with a stopwatch to each major corridor segment. Record the time for each group to transit the full segment length at each density level. Calculate a velocity ratio: peak density transit time divided by baseline transit time. For most haunts, this ratio ranges from 1.3 to 1.6 — meaning peak-density groups move 30-60% slower than baseline groups. Apply your attraction's specific ratios to each segment's baseline time to build a density-adjusted walk-through forecast that reflects your specific geometry rather than industry averages. This segment-level calibration produces a more accurate dispatch interval than any general estimate.
The pacing leak fundamentals framework from multi-room attraction design addresses the diagnostic methodology for identifying which specific chambers are creating throughput deficits — the same diagnostic applies to haunts and is the right starting point for interpreting density test data.
Building your first haunt flow model room by room before the season locks in your design geometry gives you a density-adjusted throughput estimate for each chamber before you have operational data — the model fills the measurement gap that the baseline walk-through test creates.
Replace the Baseline with the Real Number
The baseline walk-through time is a planning comfort, not a capacity tool. It produces a number that feels like precision and behaves like guesswork when the queue hits 400.
The density-adjusted number that replaces it is specific to your attraction and deserves to be calculated, not estimated. For a 14-chamber haunt running 8-minute dispatch intervals and an expected 420-ticket Saturday, the difference between a baseline-derived capacity plan and a density-corrected plan typically ranges from 60 to 95 usable ticket slots across the peak 3-hour window. That is 60-95 tickets your flow model either protects as revenue or surrenders to a fire marshal throttle. Build the corrected number from three inputs: your actual corridor widths, your chamber-by-chamber designed dwell times, and your peak-night arrival cluster distribution. Run those through a density-adjusted walk-through function calibrated at 40%, 60%, and 80% density, and the resulting dispatch interval schedule reflects the actual physical capacity of your pipes — not the Thursday baseline your gut has been operating on.
PressurePath gives haunted attraction designers a density-adjusted capacity model built from your attraction's specific geometry and your peak-night arrival distribution. The output is a dispatch interval schedule calibrated to actual peak-night walk-through velocity — not the Thursday afternoon staff test, but the 9:30 PM Saturday surge. Build your capacity plan from that number.
Your ticket count, your fire marshal relationship, and your Clown Alley actor's scare quality all depend on getting the capacity calculation right. Get the real number before October 1st.