Reading Pacing Leaks: Fundamentals of Escape Room Flow Analysis
What a Pacing Leak Actually Looks Like
Your booking grid shows Room 6 starting at 1:00 PM, 2:00 PM, and 3:00 PM. Your average group completion time is 52 minutes. You've built in 8 minutes of buffer. On paper, that's clean. By 3:00 PM, however, Room 6's group isn't starting until 3:09 PM — and by 4:00 PM you're running 22 minutes behind the original grid.
Nothing dramatic happened. No equipment failure, no late-arriving group, no emergency. The pacing leaked. Nine minutes of latency built up across three sessions through the accumulation of small, undetected delays: a 2-minute slower reset, a 3-minute host handoff overlap, a 4-minute briefing room collision at 1:47 PM that cascaded silently forward.
Xola's escape room industry statistics show that occupancy patterns create predictable peak-load windows — and those are exactly the windows where pacing leaks compound fastest. A 1-minute leak per session doesn't matter at 30% occupancy. At 90% occupancy with 8 rooms running, it's 8 simultaneous leaks feeding the same shared assets.
The 2023 Room Escape Artist industry report gives operators the baseline comparison they need: when your actual per-room cycle time diverges from the industry benchmark for your room complexity tier, you have a measurable pacing leak — and the data to locate it.
The Mechanics of Flow Analysis
Linda Green's research on queueing theory at Columbia identifies variability in service times as the primary amplifier of delays at any given utilization level. This is the fundamental mechanism behind pacing leaks: even when average cycle times are exactly on target, the variance around that average generates queue buildup at shared assets.
A concrete illustration: if your briefing room briefing takes 7 minutes on average, but ranges from 5 to 11 minutes depending on group size and host, then during a peak wave, the three groups that happen to get 9-11 minute briefings will create a 6-12 minute backlog in the junction. The groups that got 5-minute briefings happened to create slack — but that slack was consumed by other shared asset delays, not saved.
A CMU case study on queue analysis at Au Bon Pain documents exactly this dynamic: arrival-rate spikes and service variability combine to produce surprise queue buildups even when average throughput appears adequate. The key insight is that you cannot diagnose a pacing leak by looking at average cycle times — you need to analyze the variance distribution and how it interacts with arrival clustering.
Value Stream Mapping (VSM) is the core diagnostic tool for this analysis. iSixSigma's VSM framework for service operations shows how to map wait time versus processing time at each service stage. Applied to your escape room franchise: map each stage (booking arrival → lobby wait → briefing → room entry → room play → room exit → reset → photo op → lobby exit) and record both the average and the standard deviation of time spent at each stage. The stages with the highest variance relative to the adjacent stage's capacity are your pacing leak sources.
Consider a practical 8-room weekday example. Your standard deviation at the briefing stage is 2.1 minutes per group, your reset stage standard deviation is 3.4 minutes, and your photo op stage runs 1.8 minutes. On paper the photo op looks clean. But when you compare each variance to the next stage's 15-minute slot capacity, the reset station becomes the binding constraint even though briefing variance is almost as high. That's why simple average-based diagnostics miss the leak — the variance-to-capacity ratio is the number that reveals which junction will back up at 85% utilization during the Saturday 2 PM wave. Treat each variance number as pressure fluctuation in a pipe segment, and the leak becomes visible as a pressure range that exceeds the pipe's tolerance, not as a single late room.
The pressure pipe model for group flow visualization treats this same variance as fluid pressure variance — the wider the pressure range at a given junction, the more likely that junction creates cascade events on Saturday peaks.
Tulip's bottleneck analysis tools overview identifies cycle-time heatmaps and flow diagrams as the two most actionable diagnostic tools for reading flow signals. In escape room terms, a cycle-time heatmap of your room completions by time-of-day will show you exactly when variance spikes — and those spikes will align with your Saturday firefighting windows.
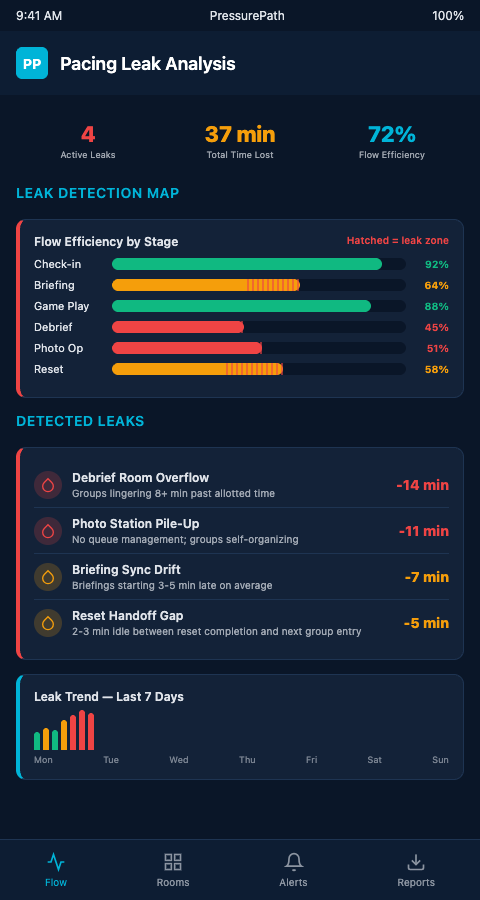
PressurePath automates this diagnostic by running your booking grid through a flow analysis engine that tracks variance propagation across shared assets. It generates a pacing leak map: a visual showing which rooms, at which time windows, contribute the most leak energy to the system. The operator sees not just that Saturday 2-4 PM is chaotic, but that "Cryogenic Breach" at 1:45 PM is the root leak driving the 3:15 PM briefing room collision.
Advanced Flow Analysis: Signals You Can Read Without New Software
Not every operator needs a full simulation tool to start reading pacing leaks. Three signals are detectable from your existing booking data and shift reports.
First: start-time drift. Compare your scheduled start times against actual start times for every room on your last three peak Saturdays. If Room 6 consistently starts 3-7 minutes late in the 2:00-4:00 PM window but not in the 10:00 AM-12:00 PM window, you have a time-of-day pacing leak, not a room-specific problem. That's evidence of a shared asset bottleneck that only appears under high load.
Second: end-of-shift overtime correlation. If your staff overtime consistently falls in the last 90 minutes of your Saturday shift, your pacing leaks are compounding through the day and hitting maximum latency at close. This is predictable from queueing math — the M/M/1 queue model predicts that utilization above 85% causes non-linear queue growth — and it shows up as a staffing cost problem rather than a scheduling problem.
Third: staff dashboards that surface traffic jams early give your Game Masters real-time pacing data to act on, but they only help if the underlying pacing leak signals have been diagnosed and translated into threshold alerts. The dashboard is the instrument panel; flow analysis is the engineering that tells you which gauges to watch.
A restaurant study on resource interaction and waiting times measured how resource allocation at sequential service stages directly drives wait-time outcomes. Escape room franchises face the same sequential structure: each stage in the group journey competes for shared resources, and misallocation at one stage propagates through the rest. Understanding which stages are the root pacing leak sources — not just which ones are visibly congested — is what separates reactive firefighting from proactive flow management.
The walk-through capacity myths that affect haunt operators parallel this directly: reported walk-through times are averages that hide the variance that actually drives capacity constraints, and the same is true of escape room booking intervals.
Start Reading Your Leaks Before Next Saturday
Franchise operators running 8 or more rooms across multiple peak Saturday waves can apply these flow analysis methods to their existing booking data today. If you want PressurePath to run a formal pacing leak analysis on your last three peak Saturdays and generate a variance heatmap of your room network, join the waitlist — we're currently prioritizing franchises with documented start-time drift patterns.
The pacing leak analysis maps every stage in your group journey against its variance profile and identifies which junctions amplify that variance into downstream cascading delays. Operators who submit three Saturdays of booking data with actual start times typically see a clear pattern: the same 2-3 rooms generate the majority of system-wide leak energy, and the same 1-2 shared assets absorb the compounding latency every week. Those patterns become the foundation for targeted schedule adjustments that prevent the leak from forming rather than absorbing it after it compounds.