The Pressure Pipe Model: Visualizing Group Flow Between Rooms
Groups Don't Move — They Accumulate
Saturday 1:30 PM. Rooms 2, 5, and 8 all started within a 15-minute window. Groups complete at different times, but three of them converge on the central corridor exit within 90 seconds of each other. The corridor has one Game Master monitoring it. The briefing room beyond it can hold one group at a time for photo check-out. What you have is not a scheduling conflict — it's a pressure event.
The escape room industry's $24.43 billion global opportunity by 2030, according to GlobeNewswire's market forecast, is built on dense, parallel room configurations. More rooms in the same footprint means more shared junctions, more concurrent exits, and more pressure events per shift. Understanding how groups flow between rooms isn't optional at scale — it's the difference between a profitable Saturday and a refund-filing one.
The trouble with conventional scheduling tools is they treat groups as discrete bookings moving through a linear sequence. Groups don't move that way. They accumulate at junctions, create backpressure against each other, and transmit delays forward through a network. The model you need is one that treats your franchise as a pressurized pipe network — not a calendar.
Fluid Dynamics as an Operational Framework
Research from arXiv on fluid-based analysis of pedestrian crowds at bottlenecks mathematically establishes that dense pedestrian flow follows pressure-drop equations: clogging at a junction follows the same physics as pressurized fluid backing up in a restricted pipe. A 2024 paper in Taylor & Francis modeling crowd pressure via continuum approach extends this further, showing that the "pressure term" behind a bottleneck quantifies how density forces congestion forward into the next segment.
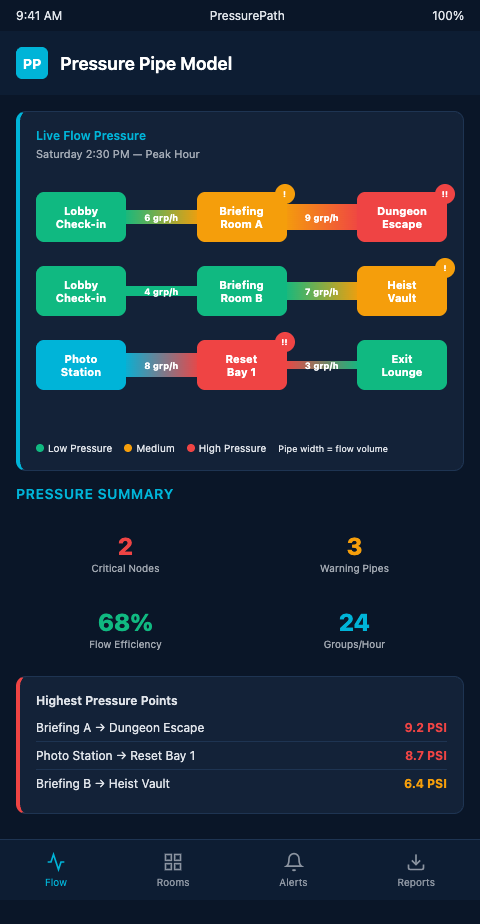
Applied to your franchise: each room is a pressurized segment. The fluid inside is your group — moving, occupying space, consuming staff attention. The corridor between rooms is the pipe. The briefing room, the photo wall, the reset station — these are junction nodes. When the pipe narrows (one Game Master covering three simultaneous exits) or the junction fills (two groups at the photo wall at once), pressure builds upstream.
GMU's Center for CFD research on pedestrian simulation maps the variables cleanly onto pipe-flow terms: velocity equals the speed of group movement between stations, density equals the number of groups in a corridor zone at once, and flux equals the rate at which groups pass through a shared asset per time unit. When flux falls below the arrival rate, the junction backs up.
Little's Law formalizes the constraint: according to its Wikipedia formulation, L = λW, where L is the number of groups in a service stage, λ is the arrival rate, and W is the average time spent in that stage. At your briefing room, if groups arrive faster than they're processed — even by 30 seconds per group — L grows without bound during a peak wave. You can't schedule your way out of this without modeling it first.
PressurePath applies this framework directly. Your 10-room booking grid becomes a pipe network diagram. Each room's expected completion time range becomes a flow rate. Each shared asset becomes a junction with a defined throughput capacity. The simulator runs your Saturday as a fluid flow event and flags every window where junction pressure exceeds throughput capacity. That's the pacing leak reading fundamentals applied at the network level rather than the individual room level.
The model also captures a dynamic that static scheduling misses entirely: cascade propagation. A ScienceDirect paper on pedestrian flow restriction demonstrates that a flow restriction at a single point reduces upstream capacity system-wide. In your franchise, this means a 4-minute delay at the photo wall at 2:00 PM reshapes every room's effective start window through 4:00 PM — even rooms that have nothing to do with the photo wall.
Building the Pressure Map for Your Franchise
Turning the pressure pipe model into an actionable operations tool requires three inputs: your room layout (which rooms share which corridors and junctions), your booking grid (when each room starts and its expected duration range), and your staffing configuration (how many hosts or Game Masters cover each zone).
Start with the physical layout. Draw every shared corridor, briefing area, reset station, and photo wall as a node. Connect rooms to nodes with directed edges showing the flow direction after completion. This is your pipe network diagram. It doesn't need to be elaborate — a whiteboard sketch with labeled nodes is sufficient to begin.
The first flow map for your multi-room operations is this physical diagram, and it becomes the foundation for every simulation run you do afterward.
Next, annotate each node with its throughput capacity: how many groups can this junction process per 10-minute window? A briefing room that takes 8 minutes per group briefing can handle 1.25 groups per 10 minutes. If three groups arrive within 20 minutes, that node will be in deficit for 40 minutes.
Finally, overlay the booking grid. Mark each room's expected exit window (start time + average completion time ± variance) against the nodes it feeds. Any window where two or more rooms feed the same node within the same 10-minute span is a potential pressure event.
The key difference between this model and a simple collision check is that it accounts for the fluid behavior that makes pressure events non-obvious. Because pressure propagates backward through the network — as the spatial pacing primer from immersive theater production designers explores from the opposite direction — a late-running room in zone C can create pressure at the briefing room node in zone A. You'd never catch that with a per-room schedule audit.
Three Diagnostic Outputs the Model Produces
The pressure pipe model generates three outputs that conventional scheduling tools don't: a junction pressure timeline, a cascade propagation map, and a staffing delta table.
The junction pressure timeline shows every node in your network and its projected utilization at 15-minute intervals across the shift. Any interval where a node exceeds 85% utilization is flagged as a pressure event. The 85% threshold comes from queueing theory: at that utilization level, queue length begins growing non-linearly.
The cascade propagation map shows which primary pressure events generate secondary events, and when. If the photo wall hits peak pressure at 2:15 PM, the map tells you whether that creates a downstream pressure event at the briefing room at 2:45 PM or a reset station backlog at 3:00 PM.
The staffing delta table shows the minimum staffing addition or schedule shift required to bring each pressure event below the 85% threshold. Not "add one more GM" as a blanket recommendation — specific adjustments for specific 15-minute windows on specific nodes.
This is what makes the pressure pipe model operationally useful rather than academically interesting. It doesn't tell you that Saturdays are busy. It tells you that room 4's 2:00 PM slot should start at 2:05 PM, and room 9's 3:15 PM slot should shift to 3:20 PM, to prevent the 4:10 PM briefing room cascade.
Get Early Access
Multi-room franchise operators managing 8 or more parallel rooms are exactly who PressurePath was built for. If you want to model your actual booking grid as a pressure pipe network and see your Saturday collision map before it runs live, add your name to the waitlist — we're onboarding franchise operators in cohorts and will prioritize venues with 10+ rooms.
Each onboarding cohort receives a full pressure pipe analysis of their Saturday operations: junction pressure timelines, cascade propagation maps, and staffing delta tables calibrated to their specific room layout and booking density. The analysis typically surfaces 3-5 non-obvious collision windows per peak shift that standard scheduling tools never flag, along with the precise start-time offsets needed to prevent them.