Building Your First Flow Map for Multi-Room Operations
Why Your Booking Software Isn't a Flow Map
Booking platforms are excellent at managing time slots. They tell you which room is available when, which group is assigned to which slot, and how many bookings remain open for Saturday. What they don't tell you is what happens in the physical space between those slots.
The Nicholson facility survey of 175 escape room venues documents that most multi-room facilities share corridors, central hubs, and briefing infrastructure. Your booking software doesn't model any of that. It knows Room 7 starts at 2:00 PM and Room 9 starts at 2:05 PM. It doesn't know that both rooms feed the same 12-foot corridor, which feeds the same briefing room, which has one host managing check-out for both groups.
The GlobeNewswire forecast for a $24.43 billion escape room market by 2030 points to franchise expansion as the primary growth driver — which means operators are increasingly opening second and third locations with the same floor plan assumptions they used at their first location, without validating those assumptions operationally. A flow map is the validation step that gets skipped.
A flow map is not a floor plan. A floor plan shows physical dimensions. A flow map shows movement paths, junction nodes, and the throughput capacity of each node. Those are different things, and confusing them is why most multi-room franchises only discover their corridor bottleneck on the Saturday they open.
How to Build Your First Flow Map
The Lean Enterprise Institute's Value Stream Mapping framework is the foundational tool. Its VSM documentation defines the methodology for mapping current-state versus future-state flow in any service operation. Asana's VSM implementation guide breaks it into actionable steps: identify every stage in the service process, record cycle time and wait time at each stage, mark the flow path between stages, and annotate with throughput capacity.
Applied to a 10-room franchise, the process has five steps.
Step 1: List every stage a group passes through. This is the complete journey: parking lot arrival → lobby queue → booking check-in → briefing room → corridor to room → room play → room exit → post-game photo wall → lobby exit. For multi-room operations that offer bonus rooms or sequential room packages, add those nodes explicitly.
Step 2: Draw the physical paths. Trace the actual corridor routes between stages on a simplified sketch. This is not a detailed architectural drawing — use circles for nodes (stages) and arrows for corridors (flow paths). The process mapping for bottleneck identification method from Clear Business Outcome shows that even a rough sketch-level map exposes existing and potential bottlenecks that verbal descriptions of the same space never reveal.
Step 3: Annotate each node with capacity. For every node, record the maximum number of groups it can handle simultaneously, the average processing time per group, and the staff required. The briefing room: 1 group at a time, 7 minutes average, 1 host. The photo wall: 2 groups at once, 4 minutes per group, 0 dedicated staff (self-service). The central corridor: 3 groups simultaneously without congestion, 2 minutes average transit.
Step 4: Identify shared nodes. Circle every node that more than one room feeds into. These are your pressure junctions — the pipes that receive flow from multiple sources. In most 8-10 room franchises, there are 3-5 shared nodes. These are the locations your flow map is most valuable for.
Step 5: Overlay your booking grid. For each time block on your Saturday schedule, mark which rooms are simultaneously active and which shared nodes they feed. Any time window where multiple active rooms feed the same shared node within a 10-minute window is a candidate for a pressure event.
The pressure pipe model for group flow treats these shared nodes as pipe junctions with defined inlet and outlet flow rates. Your flow map gives you the topology; the pressure model gives you the dynamics.
Spatial zoning concepts from architecture provide useful translation tools here. Architecture zoning diagrams and venue flow mapping for event spaces both use the same principle of dividing physical space into zones connected by labeled flow paths — and the vocabulary translates directly to escape room multi-room mapping.
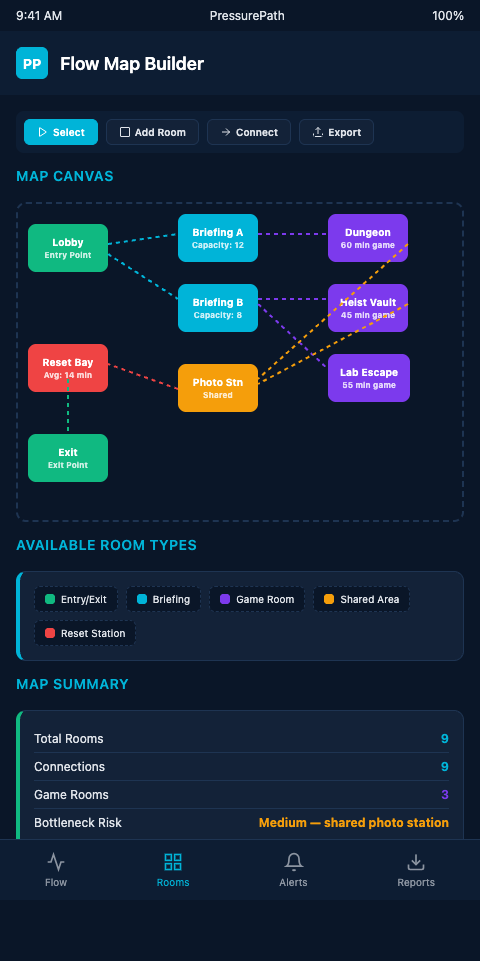
PressurePath uses your flow map as the structural foundation for all simulation runs. You enter your room layout, shared node configuration, and booking grid once — and the simulator generates pressure timelines for every node on every simulated Saturday. The flow map you build in PressurePath is also exportable as a training document for new staff, giving Game Masters a visual reference for corridor congestion zones during peak hours.
The map behaves like a pressurized pipe network schematic: each shared node has a rated throughput, and each room acts as an upstream pressure source feeding into the network. When three rooms feed the same briefing junction within a 9-minute window, the junction sees roughly 120% of its design throughput for that window — and that 20% overage is exactly where the pressure buildup becomes visible on Saturday afternoons. A 10-room franchise running four parallel sessions at 70% occupancy might see 6-8 such windows across an 8-hour peak day, clustered between 1 PM and 4 PM when bookings compress. The flow map makes each of those windows a labeled coordinate on the grid rather than an unnamed 3-minute crisis at 2:47 PM.
What Your First Flow Map Will Reveal
Most operators building their first flow map discover three things they didn't know before.
First: their central briefing hub is more constrained than they realized. When you annotate it with actual throughput capacity — 1 group per 7 minutes — and overlay all rooms that feed it, the peak windows where it reaches 100% utilization are often 30-40% more frequent than operators estimated verbally.
Second: there are dead corridors. Paths that exist on the floor plan but that groups rarely use because they're inconveniently routed. These are latent throughput capacity that can be activated with minor signage changes — but you'd never know they existed without the flow map showing you the asymmetric group routing patterns.
Third: one or two rooms are disproportionate pressure generators. Not because they're poorly designed, but because their position in the network topology means they feed two or three shared nodes in sequence. Those rooms are where a booking spacing adjustment has the highest system-wide impact.
Multi-location pacing consistency best practices depend on having a canonical flow map for each location — because the same room names and booking cadences can have completely different flow dynamics at different physical sites. The flow map makes those differences visible before you replicate a problem from Location A into Location B.
The children's museum floor mapping methodology approaches the same spatial analysis challenge from a different operational angle — and operators who've done flow mapping in both contexts consistently report that the escape room map is the harder one to build accurately, precisely because group completion time variance is much wider than exhibit dwell time variance.
Join the Next Onboarding Cohort
PressurePath gives multi-room escape room operators a structured flow map builder that turns your physical layout and Saturday booking grid into a live pressure network simulation. If your franchise runs 8 or more rooms and you've never built a formal flow map, the onboarding process starts there — and the first simulation run is included. Join the waitlist to secure a spot in the next operator cohort.
The flow map onboarding session walks you through every node in your franchise network, from lobby intake through post-game exit, and annotates each with real throughput capacity numbers derived from your booking data. Operators who complete their first flow map consistently report that the visual representation reveals 2-3 shared asset constraints they had never formally identified despite years of operating the space. The first simulation run takes that completed map, overlays your actual Saturday booking grid, and generates a pressure timeline for every node — giving you a concrete, data-backed view of exactly where and when your Saturday operations will encounter congestion before you open the doors.