Peak-Hour Capacity: Calculating Your True Throughput Ceiling
Your Booking Software Is Lying About Your Capacity
A 10-room franchise with 60-minute room sessions can theoretically complete 10 groups per hour. If you run 10 hours, that's 100 group completions per day. Your booking platform will happily sell 100 slots.
But your briefing room handles 8 groups per hour. Your reset team handles 6 room turnovers per hour across the full franchise. Your photo wall handles 12 groups per hour. Your single corridor junction to rooms 4-7 handles 3 simultaneous transits. None of those constraints appear in your booking count. They're invisible to the platform — but they're completely real to your Saturday.
Room Escape Artist's 2024 industry report documents recurring Saturday peak patterns as an industry-wide phenomenon. The operations challenge isn't that Saturday is busy — it's that most franchises have never calculated the true throughput ceiling that their shared asset network actually permits at peak load. They're operating against a theoretical maximum, not a real one.
The true throughput ceiling is the lowest throughput of any node in your system's network — your binding constraint. When you book above that ceiling, the system doesn't crash cleanly. It degrades: queues form, staff firefight, guests wait. The Friday night booking count looks fine. The Saturday afternoon operations look like a crisis.
Calculating the Real Ceiling With Queueing Math
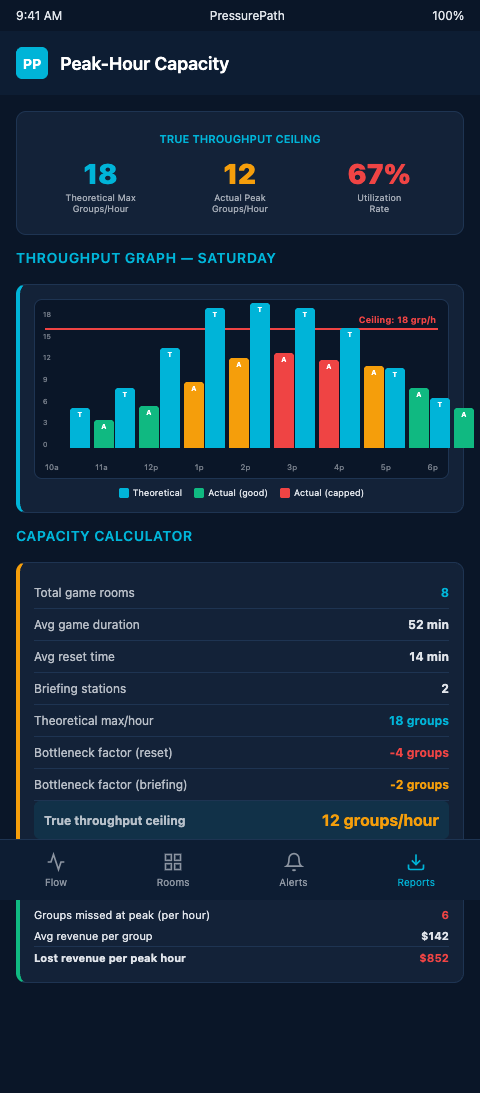
Little's Law provides the foundational relationship: L = λW, where L is the number of groups in the system at once, λ is the throughput rate (groups per hour), and W is the average time a group spends at a given stage. Rearranged: λ = L / W. Your briefing room can hold 1 group at a time (L = 1), processes a briefing in 7 minutes (W = 0.117 hours), so its maximum throughput is λ = 8.57 groups per hour. That's your briefing room's throughput ceiling.
Repeat this calculation for every shared node in your franchise: the photo wall, each reset station, each corridor junction, and each staffed handoff point. The lowest result is your system-wide throughput ceiling. Any booking cadence that drives throughput above that ceiling at any node will create a queue at that node.
The M/M/1 queue model adds the critical stability condition: a queue is stable only when utilization ρ < 1. At ρ = 0.85, queue length is already growing non-linearly. This means your practical throughput ceiling — the ceiling below which the system behaves predictably — is 85% of your theoretical maximum throughput, not 100%.
For a briefing room with a maximum throughput of 8.57 groups per hour, the practical ceiling is 7.28 groups per hour. If your booking cadence drives briefing room arrivals above that rate during peak Saturday hours, you will have a growing briefing queue — not sometimes, but structurally, every time.
ASCE's peer-reviewed methodology for peak-hour capacity analysis formalizes the derivation of true peak-hour capacity from empirical counts rather than theoretical maximums. The method applied to your franchise: count actual briefing room throughput on your last three peak Saturdays (groups processed per hour during the 1-4 PM window), and compare it to your booking density in those windows. If your booking density exceeds your empirical throughput count in those windows, you're above your true ceiling.
A ScienceDirect simulation study on campus dining capacity demonstrates that matching service capacity to true arrival peaks prevents both under-staffing and over-staffing: systems that model actual arrival distributions rather than average arrival rates end up with more accurate capacity ceilings and less wasted labor. The parallel to escape room franchises is direct — your Saturday booking pattern has a peak arrival distribution, and your capacity ceiling should be calculated against that distribution, not against your daily average.
PressurePath runs this calculation automatically. You load your room network topology, your shared asset throughput rates, and your Saturday booking grid, and the simulator calculates the true throughput ceiling for each node at each 15-minute interval. It generates a capacity map showing your franchise's real booking limits — the constraints that prevent queue formation rather than the theoretical maximum your room count suggests.
Translating the Ceiling Into a Booking Policy
Knowing your true throughput ceiling is only useful if it shapes your booking configuration. Three policy changes flow directly from this analysis.
Cap peak-window bookings at 85% of true ceiling, not 100%. The 15% buffer absorbs the variance in group arrival times, reset durations, and briefing session lengths that are inherent to escape room operations. Booking to 100% of theoretical capacity means any variation triggers a queue. The 85% cap gives the system recovery space.
Apply node-specific caps, not venue-wide caps. If your briefing room ceiling is 7.3 groups per hour but your reset stations support 9 groups per hour, a venue-wide cap of 7.3 groups per hour is unnecessarily conservative for the 70% of your schedule that doesn't stress the briefing room. Node-specific caps let you optimize throughput windows that don't stress the binding constraint while enforcing limits on windows that do.
Model before you cut. The instinct when calculating a lower-than-expected ceiling is to immediately reduce bookings to match. But the ceiling is not fixed — it's a function of your shared asset configuration. Adding a second briefing host during the 1:30-3:30 PM window raises your briefing room ceiling from 8.57 to 17.14 groups per hour — more than enough to accommodate your current booking density. The PressurePath analysis shows which staffing additions raise the ceiling most efficiently.
The pacing simulations versus booking buffers comparison addresses this tradeoff directly: booking buffers (uniform gaps between all slots) are a blunt instrument that reduces overall throughput to protect against worst-case congestion. Pacing simulations identify the specific windows where the ceiling is actually threatened and apply precision interventions there, preserving throughput everywhere else.
Walk-through capacity myths for haunted attraction operators explore the same misalignment between reported capacity (based on walk-through averages) and true capacity (based on actual bottleneck throughput). The distortion mechanism is identical across venue types: aggregated averages hide the node-level constraints that determine real operational limits.
Hospitality operators apply demand forecasting to this problem. EHL's hotel demand management research documents how proactive capacity limits outperform reactive waitlists — and escape room franchises with accurate throughput ceilings can apply the same logic: set the booking limit to match the true ceiling, sell out confidently at that limit, and avoid the firefighting cost of exceeding it.
The parallel booking contamination dynamics in multi-room franchises describe what happens operationally when a ceiling is exceeded — adjacent booking slots absorb the overflow pressure, and the contamination pattern propagates across the shift in a way that's invisible to booking data but obvious in operations.
Model Your Ceiling Before You Sell It
Multi-room escape room operators who've never calculated their true throughput ceiling are selling capacity they don't reliably have. If you run 8-12 rooms and your Saturday peak hours consistently produce firefighting regardless of staffing level, the ceiling calculation is the missing piece. PressurePath builds it from your actual room network and booking grid — join the waitlist and we'll run your ceiling analysis as part of onboarding.
The ceiling analysis calculates your true throughput limit at every shared node across every 15-minute interval of your peak Saturday. The output is a capacity map showing where your current booking density exceeds your practical ceiling and which specific staffing additions or schedule adjustments would raise the ceiling most efficiently. Operators who complete the analysis gain the confidence to sell up to their real capacity limit without triggering the queue formation and firefighting that comes from exceeding it unknowingly.