Machine-Learned Audience Prediction for Long-Run Productions
200 Performances In, and the Director Still Guesses Which Rooms Will Fill
Opening night instincts harden into assumptions. A director who built a show for 90 audience members at the height of the pandemic has three years of post-reopening data sitting in SM logs, ticket systems, and cast notes — and almost none of it has been systematically analyzed. The audience behavior study from American Theatre found the sector hasn't returned to pre-pandemic revenue levels, with behavioral shifts visible in ticket-purchase data. But purchase data tells you who's coming, not what they'll do once they're inside.
Long-run productions have a structural advantage over short runs: they generate enough repetition to identify patterns that can't be seen in a single performance or even a single month. The problem is that without a machine learning layer, those patterns exist only as vague impressions — "Saturdays tend to be bigger in the East Wing," "the 8pm crowd pushes into the ballroom more than the 6pm." These impressions are real but imprecise, and imprecision means the stage manager still improvises cue timing from feel rather than a calibrated model.
ML algorithms predict crowd behaviors and movements for resource allocation (AWS, Engage Your Audience With Machine Learning) — the same logic applies inside a venue across performance-to-performance variation. When a production has 200 data points, the machine can begin to generalize.
Building the Prediction Pipeline
The pipeline has three layers: data ingestion, pattern extraction, and forward simulation.
Before any model runs, the production needs a defined checkpoint protocol. This is the most common gap between productions that successfully build ML-ready datasets and productions that accumulate 200 nights of unusable data. A checkpoint protocol specifies which scenes get head-count observations, at what minute mark, by which member of the production team. It standardizes the definition of "a scene observation" — does the count include audience members in the adjacent corridor, or only those inside the scene's physical boundary? Does it capture the peak count during the scene's window, or the count at minute 15 of a 20-minute scene?
The answer to each of these questions changes the training data profile significantly. Productions that define the protocol at performance one and maintain it consistently generate ML-ready data. Productions that leave checkpoint format to individual SM discretion generate data that resists modeling because the measurement instrument varies performance to performance. PressurePath provides a checkpoint protocol template as part of setup, formatted for stage managers who have no prior ML data discipline experience.
Data ingestion for an immersive production means combining SM logs (room head counts at defined checkpoints), ticket batch demographics (group size, advance vs same-day purchase, any group-type coding from ticketing), and cast-rotation records. Taken together, these inputs describe the conditions of each performance. Modern platforms ingest CRM, marketing, social, and demographic data to predict attendance and behavior (AI-Powered Data Analysis, Eventbrite) — for a theatrical production, the equivalent is the SM's checkpoints merged with the box office database.
Pattern extraction is where the ML model earns its value. XGBoost and SVM outperform logistic regression for individual attendance prediction (Predicting Event Attendance With Machine Learning, Tandfonline) — but for immersive theater, the prediction target isn't whether someone attends; it's which room they'll occupy at minute 47. Gradient-boosted tree models handle the non-linearity in this prediction well because audience drift is conditional: whether you end up in the Library depends on where you were at minute 35, which depends on how the Solarium scene was populated, which depends on the ticket batch's group-size distribution.
After 50 performances, the model can reliably segment performances into behavioral archetypes: the "ballroom-heavy" configuration that emerges on Saturday evenings with large group bookings, the "corridor-grazer" pattern common in small-group midweek audiences who linger between scenes, the "magnet-scene-collapse" pattern that appears with cast Rotation B when a key performer's draw is weaker.
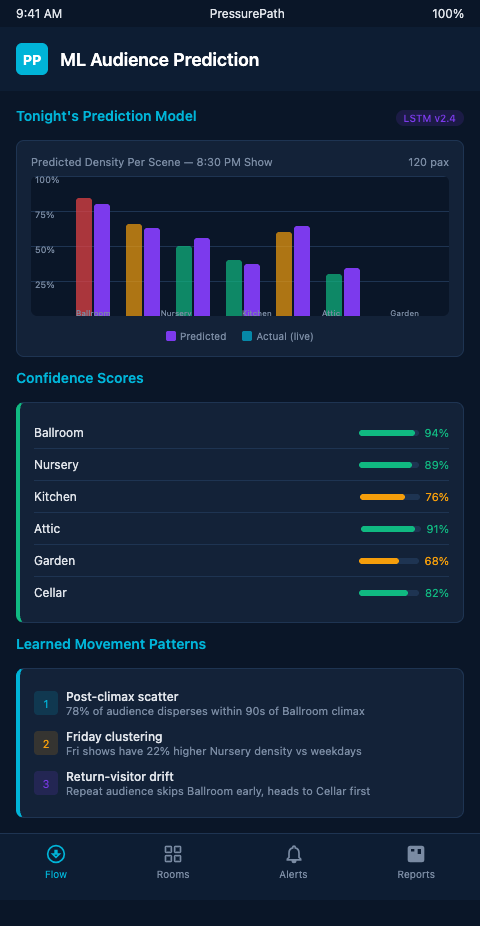
PressurePath connects the pattern extraction layer to a forward simulation: given tomorrow night's ticket batch and rotation schedule, the model generates a predicted scene-by-scene head count distribution across all acts. The stage manager receives the prediction before house open and adjusts pre-set cue timing if any scene is forecast to underperform its sightline minimum.
Big data analytics enables audience behavior analysis and revenue maximization (Big Data Analytics in Entertainment, ResearchGate) — for a long-run production, behavior analysis feeds directly into set and cue optimization rather than marketing decisions. The optimization target is blocking arc integrity, not ticket conversion.
The connection to multi-act drift prediction models is direct: the ML layer provides the prior probability distribution that drift models use as their starting state. Without performance history, drift models start from a flat prior. With 200 performances of labeled data, they start from a calibrated one — and the prediction accuracy for Act 2 scene distributions improves significantly.
Long-Run Applications: What the Model Unlocks After 50, 100, 200 Performances
At 50 performances, the model can flag systematic underperformers: scenes that consistently fall below their sightline targets regardless of ticket batch. These are design problems, not prediction problems — and identifying them at 50 performances rather than 200 saves hundreds of nights of degraded audience experience.
At 100 performances, the model can generate rotation-aware predictions: "With Cast Rotation B, expect the West Gallery scene to run 18% below target in Act 3. Pre-position usher on south corridor 6 minutes earlier than standard cue sheet." This recommendation is actionable before the house opens.
At 200 performances, the model achieves something more interesting: it can identify long-range drift — gradual shifts in audience behavior that accumulate over months and aren't visible in week-to-week comparisons. If the show's central magnet scene has been slowly losing pull since month four, the aggregate pattern shows it clearly even when no single performance looks unusual.
Audience facial expression correlation accounted for up to 24% of predicted engagement during live performances (PMC) — this biometric layer represents the leading edge of what production-level ML will incorporate over the next few years. PressurePath currently operates on behavioral location data, and the architecture supports sensor inputs as they become available to productions.
Scene density tracking tools are the data collection infrastructure that feeds this pipeline. Without consistent head-count checkpoints, the ML model has no training data — the prediction layer is only as good as the input it receives from the stage manager's tracking protocol.
Cross-format validation is also instructive: machine-driven spawn-in timing in haunted attractions uses the same gradient-boosted prediction approach to manage crowd flow in high-throughput Halloween environments. The immersive theater application has lower throughput but higher per-scene behavioral precision requirements.
The Machine Gets Smarter While the Show Runs
Most long-run productions operate on institutional memory: the SM who's been there since week three knows the show's behavioral quirks. When that SM leaves, the knowledge leaves with them. A trained ML model is institutional memory that doesn't quit. It persists across rotation changes, staff turnover, and venue variations.
The operational value compounds over time in a specific way. At performance 50, the model's predictions are approximately 65% accurate at the scene-level: it correctly forecasts whether a given scene will run above or below its sightline target in about two-thirds of cases. By performance 100, that accuracy is typically around 78% — driven by the additional training data and the model's ability to weight ticket-batch features more precisely. By performance 200, accuracy stabilizes in the 82-86% range; beyond that point, the model is primarily updating its coefficients for seasonal effects, cast changes, and slow trend detection rather than improving its baseline scene-distribution predictions.
That 82-86% accuracy at 200 performances means the SM goes into roughly 17 of every 100 performances with a predicted distribution that turns out to be wrong. That's not a failure — it's the residual uncertainty from genuine audience randomness. The value is that the SM no longer goes into 100 of 100 performances uncertain. The uncertainty has been reduced from 100% to 17%, and the 17% is concentrated in identifiable conditions: unusual ticket batch compositions, cast illness substitutions, weather-driven demographic shifts. The model flags these high-uncertainty performances explicitly, allowing the SM to prepare broader-range contingencies rather than relying on the point forecast.
This uncertainty quantification is what separates a useful production tool from a false-confidence generator. PressurePath surfaces confidence intervals alongside its scene-distribution forecasts — not just "the East Wing will have 22 people" but "the East Wing will have 18-26 people with 80% probability given tonight's ticket batch profile."
Immersive theater companies 50 or more performances into a long run have data that a predictive model can learn from right now. PressurePath offers long-run production audits for companies interested in understanding what their performance archive is actually telling them about audience flow — before the show's last night makes that data a retrospective rather than a tool. Join the waitlist for early access and reserve your spot in the next audit cohort.
A note on what the ML model should not be expected to do: it should not predict individual audience member behavior. The prediction target is aggregate scene populations — the expected number of viewers in each room at defined checkpoints — not the choices of any specific ticket holder. This aggregate focus is both the appropriate privacy frame and the correct technical target. Individual behavior is too noisy to predict reliably across the population variance of ticket batches. Aggregate behavior, averaged across the 80-150 bodies in a typical performance, is far more predictable because the law of large numbers smooths out individual variance. Productions that understand this framing adopt the tool with accurate expectations and use it effectively. Productions that expect individual-level prediction are disappointed by results that are actually quite good at the aggregate level.
The scene density tracking infrastructure that feeds the ML pipeline is also the output infrastructure: the same checkpoint protocol that generates training data generates the live performance data the model predicts against. Building the protocol once serves both functions throughout the run.