Workflow Tools for Tracking Scene Density Across Performances
The SM's Tally Sheet and Its Limits
The stage manager's headcount tally from last Saturday says Scene 4 hit 43 viewers at minute 22. The same tally has a running annotation field where the SM has noted "check entry protocol" for three consecutive Saturdays. Nobody has checked the entry protocol, because there is no mechanism to convert three individual show-report annotations into a production-level action item. The annotation disappears into the archive of individual show reports, which nobody reads in aggregate.
The tally from the previous Saturday says 38. The one from the week before says 51. The calling SM circled 51 in red and wrote "check entry protocol." But the production has no mechanism to compare those three readings against each other, against Scene 4's sightline ceiling of 32, or against the average across all 28 nights so far. The pattern that those numbers contain — Scene 4 structurally overloads every Friday and Saturday night above a show attendance threshold of 180 — is invisible because the data was never aggregated.
Manual headcount tallying is the production industry's default density tracking tool and its fundamental limitation. Tallies collected per night, per SM, and entered into individual show reports cannot be analyzed across performances without a data aggregation step that most productions never complete during the run. By the time post-mortems happen, the granular night-by-night data has been distilled into impressions: "Scene 4 ran hot" and "the conservatory felt thin on weekdays."
Data Analytics in Entertainment (Cast & Crew) characterizes this shift: entertainment operations moving from assumption to evidence requires not just data collection but data persistence and cross-run analysis. The assumption that Scene 4 runs hot is confirmed by a three-night sample. The evidence — that Scene 4 exceeds its sightline ceiling 78% of weekend nights and 31% of weeknight performances — requires 30 nights of structured tracking.
Immersive Audiences Report 2024 (IEN) identified systematic audience clustering patterns in a survey of 2,000 immersive experience attendees — patterns that density analytics can validate at the specific-scene level within an individual production's run.
Tools and Workflow for Multi-Performance Density Tracking
The tool question has two layers: how to collect density data during a live show without disrupting running protocols, and how to aggregate that data across performances for pattern analysis.
Collection layer options span the full cost spectrum. At the manual end, a structured headcount form — one row per scene, one column per check-point minute, filed per performance into a shared folder — provides the aggregation substrate that individual SM tally sheets lack. It requires no additional technology and no venue modifications. People Counting Solutions (FootfallCam) demonstrates that time-of-flight depth sensors achieve 99%+ counting accuracy for venue occupancy tracking, enabling automated per-room counts at sub-minute intervals without staff involvement. Crowd Analytics — Blickfeld LiDAR extends this to real-time density mapping and movement pattern tracking across multi-zone venues.
Occupancy Sensors (Density.io) occupancy sensors, designed for building management, can be repurposed as per-room density trackers with data persisted over time — generating per-room utilization logs across a full production run without any staff data entry.
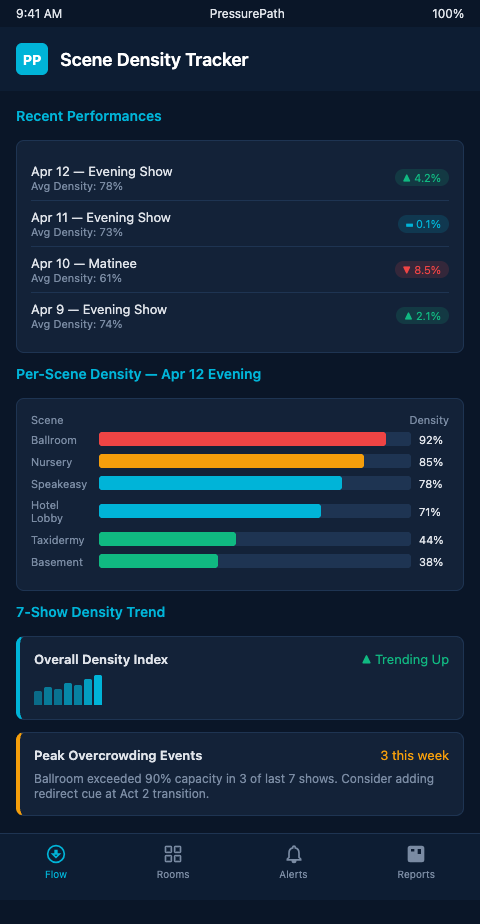
Aggregation layer options. PressurePath aggregates headcount data across performances using the same pipe network model that drives the pre-show simulation. Each performance's headcount data updates the model's baseline, refining its prediction accuracy for subsequent nights. After 15 performances, the model has accumulated enough variance data to distinguish between scenes that reliably run at designed capacity, scenes that reliably overload, and scenes that exhibit high variance — which often indicates an environmental or routing factor that changes with audience composition rather than a fixed structural problem. Rather than just tracking which scenes ran hot, the aggregation layer identifies the relational patterns: when Scene 4 overloads, what happens to Scene 7 in the subsequent 8 minutes? Which act transition precedes the highest-variance distribution nights? The 30 performances audit approach covers the audit methodology; this post focuses on the tracking tools that make the audit possible.
AI In Performance Analytics (Meegle) describes ML-enabled pattern recognition across repeated events — the exact application of finding structural density patterns in an immersive show's run data. The minimum viable version of this is a structured spreadsheet; the full version is a persistent model that updates its predictions based on each additional night's data.
The packed scene detection analysis addresses what to do when a chronic overload scene is identified; density tracking is the tool that makes that identification reliable rather than impressionistic.
Advanced Tactics: Using Density Data to Drive Blocking Changes
The most direct application of cross-performance density data is blocking arc revision. When PressurePath's aggregation layer shows that Scene 4 exceeded its sightline ceiling on 22 of 28 tracked nights, the director has evidence-supported grounds for a structural change — not just a note to ushers to hold entries harder.
The distinction between a structural change and an operational adjustment is important. Telling ushers to hold Scene 4 entries harder is an operational adjustment — it addresses the symptom without touching the cause. If the cause is that Scene 4 sits at a confluence of three major circulation paths and viewers naturally accumulate at circulation confluences, the operational adjustment will need to be executed with increasing force every night until the run ends. A structural change — relocating Scene 4 to a less-trafficked position, adding a competing scene at the circulation confluence, or redesigning the corridor entry geometry — addresses the cause. Density tracking across 28 nights provides the evidence to distinguish these two cases.
The blocking arc integrity score that PressurePath generates per performance measures how closely the actual audience distribution matched the director's intended spatial composition across the full show. When this score is correlated against per-scene density data, it reveals which specific scenes are responsible for the most blocking arc deviation. Directors reviewing this correlation often discover that one or two chronically overcrowded scenes account for the majority of blocking arc failures — making the structural change decision much more targeted than a general "improve flow" directive.
Density data also enables the production to make the case for blocking revisions to actors who have been performing in the overcrowded condition for weeks. An actor told that "Scene 4 gets crowded sometimes" may not prioritize adapting their blocking. An actor shown that their scene exceeded its sightline ceiling on 22 of 28 nights and that the blocking arc integrity score for that scene is 34% below the production average has a concrete, evidence-based reason to engage with the revision.
Structural changes informed by density data take three forms. Scene capacity revision: the sightline ceiling was set during tech based on the designed blocking; the actual occupancy patterns may support a revised ceiling if the staging accommodates a wider range of viewer positions. This is a deliberate design decision, not a concession to drift. Entry sequence redesign: the scene's position in the audience's promenade path contributes to its overcrowding; flow modeling can test whether a modified scene sequence redistributes the Act 1 audience more evenly. Magnet scene insertion: a new or revised adjacent scene can draw viewers away from the chronically overloaded room.
Real Time Visual Crowd Analysis (PMC/NIH) establishes that density map estimation applied frame-by-frame to performance video enables post-hoc auditing — a lower-cost retroactive option when live sensor data is not available.
The staff dashboard alerts model from multi-room escape room operations uses comparable aggregation logic: per-room density readings accumulated across sessions surface traffic patterns that nightly reports obscure. The immersive theater application adds the complication of dynamic audience routing, but the core workflow — persistent tracking, cross-session aggregation, pattern-driven operational change — is identical.
Productions managing a 60-night run without density tracking are making blocking decisions on impression and anecdote. Productions with structured tracking from night one arrive at week four with 28 nights of scene-level data informing every directorial and operational decision for the remainder of the run.
Install the Tracking Workflow Before Opening Night
The tracking workflow requires two decisions before the run begins: what data to collect at each performance (scene, time point, headcount), and where to aggregate it (shared folder, spreadsheet, PressurePath database). Both decisions take less than an hour during tech prep. The data they enable to be collected across the run is irreplaceable.
A third decision that often gets deferred until after opening night — and should not be — is who owns the tracking workflow. Productions that assign the tracking responsibility to the SM as an afterthought to their existing duties report high abandonment rates by week two: the SM is already operating at full cognitive load during running calls, and an additional data-entry task becomes the first thing that gets dropped under pressure. Productions that assign tracking to a dedicated deck supervisor position — or automate it through occupancy sensors so no human owns the entry step — maintain consistent tracking through the full run. The assignment decision belongs in the tech prep conversation, not in the week-two scramble when the SM quietly stops filing the forms.
A fourth consideration is the feedback loop back to the director. Data that accumulates without being reviewed weekly by the director has no operational value. The tracking workflow should include a standing weekly meeting — thirty minutes is sufficient — where the director, SM, and production manager review the aggregated data, identify the scenes requiring attention, and agree on any interventions for the coming week. Without the meeting, the data becomes a passive archive rather than an active management tool.
Immersive theater producers and directors managing multi-performance runs of non-proscenium work need scene density tracking that accumulates into pattern knowledge — not isolated night-by-night reports. Join the PressurePath waitlist for multi-performance density aggregation tools built for immersive production tracking.