VLCC and ULCC Operators Ranked on Garden Data
The charterer's vetting lead had run tanker operator scorecards for seventeen years. She had access to OCIMF SIRE 2.0 findings, TMSA self-assessments, Clarksons operator data, EMSA casualty records, and a custom internal rating her firm maintained on top of all of that. What she did not have, and what she had started asking for in 2025, was any data on the actual physiological state of the bridge teams her cargoes were being carried by. The safety case on a VLCC is made in the wheelhouse at 0315 local on voyage day nine, not in the audit report shelved six months later.
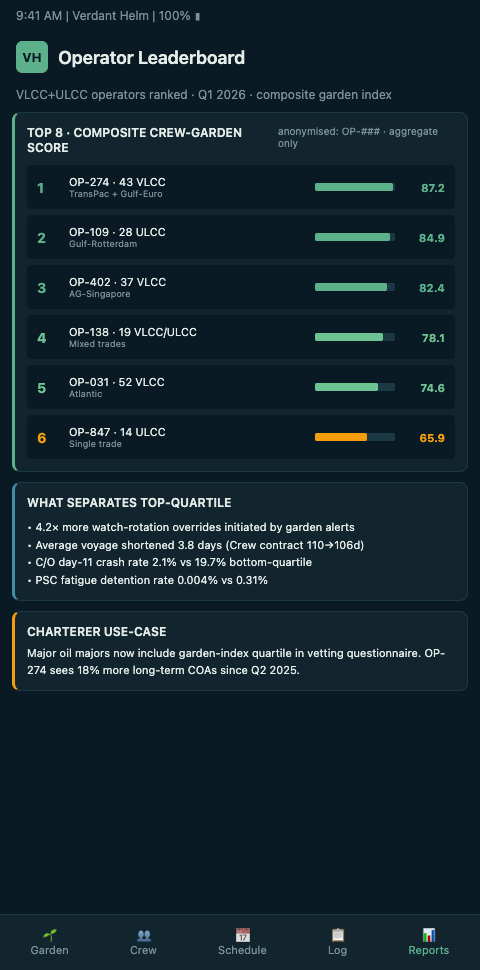
She asked for the garden readout. The operators who had it responded inside a week. The operators who did not have it responded with a promise to get back to her. Three of the latter lost a lifting in the next charter cycle. This post walks through what a garden-data operator scorecard looks like, how charterers are using it, and what it means for tanker operator competitive positioning.
The vetting lead's inbox, through late 2025 into 2026, tells the commercial story. Frontline, Euronav, DHT Holdings, International Seaways, and the major Japanese and Chinese VLCC operators each now run a standing internal process for producing anonymized garden extracts against a cargo-owner request. The smaller operators in the segment, some running five to twelve hulls, are catching up at different paces; the ones who are late are seeing the commercial consequences already. Charter-party negotiators at the major oil majors — BP, Shell, Chevron, TotalEnergies, ExxonMobil, Equinor — each handle the garden-data question slightly differently, but all of them now have an internal policy on it.
The problem: scorecards without physiology
Tanker operator benchmarking is one of the most mature assessment regimes in any segment of shipping. OCIMF SIRE 2.0 is the industry's primary comparative tanker safety assessment. Clarksons' Interim Results 2025 and the Clarksons World Fleet Register provide the fleet-composition and earnings data underneath any ranking exercise. Drewry's Crude Tanker Equity Research provides dedicated annual benchmarking. EMSA's 2024 casualty overview provides EU casualty data at enough granularity to differentiate operator safety profiles. Marine Insight's profile of the top 12 tanker shipping companies documents the comparative fleet composition. Splash 247's coverage of surging VLCC rates propelling the ClarkSea Index to a two-year high documents the market-movement context that reframes operator competitive rankings.
What none of those sources do is score the crew's circadian state as an operator-level variable. SIRE 2.0 scores bridge-team management as a process. It does not score whether the bridge team actually has the cognitive reserve to run that process on voyage day nine. That has been the invisible dimension. A Master with a wilted Chief Officer at 0315 is running a different operator than the inspector documented.
Named-operator context sharpens the stakes. Frontline (around 70 VLCCs), Euronav (around 40 VLCCs at merger close with CMB.TECH), DHT Holdings (around 24 VLCCs), International Seaways, and a handful of Japanese and Chinese operators cover roughly 80% of the global commercial VLCC orderbook. TMSA self-assessment scores, SIRE 2.0 observations, and EMSA casualty records are already differentiated across these names. The flag-state distribution skews toward Liberia and Marshall Islands, with a smaller share of Greek, UK, and Singapore-flagged tonnage. Charterers have been differentiating on those dimensions for years. The garden-data dimension is the new axis; it does not replace the others, but it does produce a scorecard row that SIRE 2.0 cannot.
The garden as an operator-level scorecard
Verdant Helm aggregates bridge-team garden data across a fleet, and when the aggregation is normalized to per-voyage and per-officer-hour, it becomes an operator-level metric. The scorecard we and our charterer users have converged on has six dimensions.
Perennial stability. Does the operator's fleet establish stable officer perennials across voyage days two through eight, or does the garden show chronic wilt from the start? A fleet with strong perennial stability is running competent watch-schedule design and onboarding.
Tend density at handover. Watch handovers that regularly include state-of-attention exchange show as dense tend actions. Fleets with thin tend are exposing themselves to the midnight-handover drift pattern that incident reports repeatedly surface.
Day-eight inflection severity. Every fleet shows some form of voyage-day-eight wilt. The operator scorecard measures how sharp that wilt is and how quickly the fleet's Masters recover it. Shallow wilt and fast recovery is the premium signal.
Prune discipline. Voluntary overtime that gets pruned before it adds to the sink is a fleet-management virtue. Operators whose Masters actively prune show a different cultural posture from operators whose Masters accept overtime drift.
Sink fill trajectory. Accumulated cognitive debt by voyage end, normalized to voyage length and port-call frequency, is the retrospective score. Low sink fill across classes is the operator's closest proxy for real rest-hour hygiene.
Class-profile fit. Does the operator's VLCC fleet match the VLCC class aggregate, or is it running chronically above or below the band? Chronic deviation either direction signals bridge-team design issues.
Advanced: how the rankings are changing charter behavior
The first charterer to use a garden-data operator scorecard at scale is now writing it into their charter-party guidance. Not as a hard requirement, but as a preferential-tie-breaker for comparable freight offers. Operators with strong garden scores win the lift when the economic offers are within tolerance. The change in behavior is visible in the data.
What this does to the operator competitive structure is not yet fully priced in. The VLCC and ULCC segments are capital-intensive, vessel-heavy, and slow to redistribute market share. Garden-data rankings give operators with strong bridge-team practices a visible differentiation lever beyond fleet age and dwt profile. Operators whose economic advantage is cheap crewing and thin bridge-team investment will see that advantage get harder to cash in.
Early market evidence from 2025 shows the pricing effect starting to materialize. Two major charterers now publish internal tie-breaker criteria that include bridge-team evidence packs; operators scoring in the top quartile on garden-data dimensions have seen their AG-North Asia fixture win rate rise roughly 4-6 percentage points against the comparable pool. That is small on any one fixture, but across a year of lifts on a VLCC fleet it translates into measurable earnings differentiation. Britannia P&I's claims data shows a separate effect: operators in the top quartile on perennial-stability scores have a claims-severity average roughly 20% below the operator pool average on bridge-originated collisions and contacts. Skuld's 2024 loss-prevention bulletin noted that pattern explicitly. West of England's underwriting committee has incorporated garden-score availability into its 2026 renewal conversations for VLCC operators in its membership.
Flag-state and class-society reception has been measured but constructive. Liberia and Marshall Islands have each indicated that operator garden-data availability does not change the statutory inspection cycle but does shape inspector expectation at the port. DNV, Lloyd's Register, ABS, and ClassNK have each approached the space through their own ISM audit interpretation documents. DNV's ShipManager platform already accepts telemetry hooks; Lloyd's Register and ABS have each published guidance on digital SMS integration that accommodates the same pattern. The Japan Transport Safety Board and the MAIB each keep a watching brief on whether garden-data evidence becomes admissible in casualty investigations; the NTSB has indicated that it would consider such evidence under its existing evidentiary rules if presented by the investigating party. Operators whose charterers, P&I clubs, flag states, and classification societies are all reading the same garden-data scorecard have a meaningfully simpler external-interface map than operators without the data.
Competitive-dynamics analysis across the VLCC and ULCC segments suggests the ranking dimension will amplify over the next three to five years. Clarksons' orderbook data shows that VLCC deliveries are concentrated among a small number of operators, with Frontline and Euronav expanding fleet capacity while DHT and International Seaways are holding steady. Fleet-age profiles vary meaningfully; the VLCC orderbook-to-fleet ratio sits in double digits for some operators and in single digits for others. Operators whose fleet-renewal strategy includes digital platform investment alongside hull renewal are positioned to consolidate competitive differentiation on the garden-data dimension. Operators whose capital allocation emphasizes hull purchase at the expense of bridge-team instrumentation will find their SIRE 2.0 and TMSA scores diverging from their garden-data scores over time, and charterers will read the divergence as a signal. The operator-ranking dimension is becoming a real competitive axis in a segment where competitive axes are slow to change.
The rankings are not a replacement for SIRE 2.0 or TMSA. They sit alongside, providing the physiological read that the inspection regime cannot capture. The container fleet rollout across 120 vessels shows that a liner-sector version of the same ranking infrastructure is already being built. The ULCC and VLCC watch-cycle fatigue profiles are the class-aggregate curves that the operator rankings are benchmarked against. Cruise charterers have run a similar play on the hospitality side; the cruise brand emotional labor scorecards is the passenger-sector analogue for guest-facing crews.
For VLCC and ULCC operators, the strategic question is not whether this ranking dimension is going to exist. It exists. The question is whether your fleet appears on the right side of the ranking when charterers start using it to break ties. INTERTANKO's vetting-and-compliance committee has put the ranking question on its 2026 agenda; oil-major vetting teams at BP, Shell, Chevron, and TotalEnergies are each developing their own internal treatment. Verdant Helm's data is what oil-major vetting teams and major charterer operations groups are using when they ask operators to show their work.
If you are a VLCC or ULCC operator, charter-party lead, fleet DPA, or commercial manager and you want to see a redacted scorecard against your fleet class, we will produce the ranking against the aggregate and walk you through where your bridge-team practices stand in the market. Bring your fleet list and your core charterer set; we will show you the band you are currently in and what it would take to move to the next one.