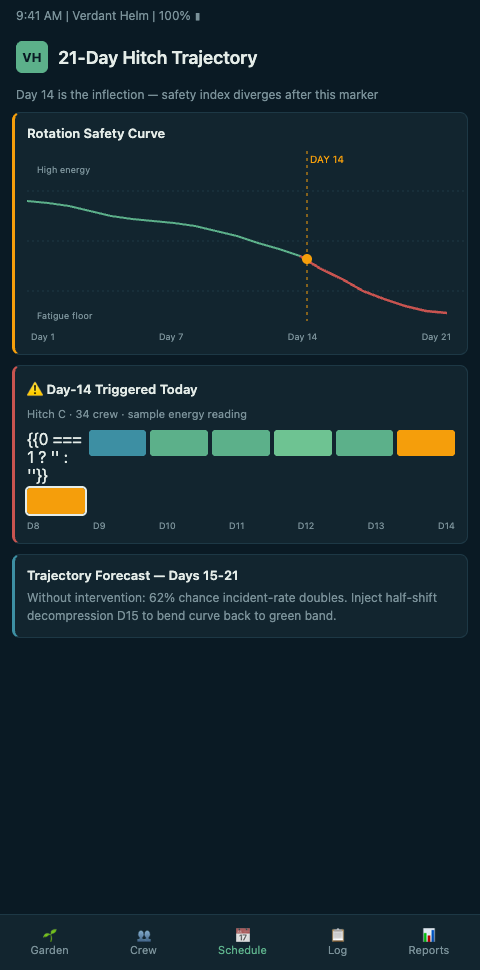
Why Day 14 of a 21-Day Rotation Sets the Safety Trajectory
The Day 14 Cluster Nobody Wants to Name
An OIM on a North Sea semi-sub pulled three years of her rig's incident reports and sorted them by hitch day. The visual that came out of that spreadsheet was a bell curve with its peak sitting squarely between days 12 and 16. First-aid cases, near-misses, dropped-object precursors, and JSA quality complaints all spiked in the same window. The rig had run safe weeks one and three. The middle was where the cost sat. She had seen the pattern anecdotally for years. Seeing it in the numbers changed what she did on day 10 of the next hitch.
The North Sea cluster is not a local artifact. A ScienceDirect study on time-of-day and days-on-shift predictors of fatigue in offshore day-shifts measured cumulative sleep loss of roughly 21 hours across a 14-day hitch, with daily post-shift subjective fatigue rising each day. A Chronobiology International study followed full 2-weeks-on / 2-weeks-off crews and found evening sleepiness and sleep-quality degradation both worsening across the hitch, with the steepest slope around the midpoint. A PubMed analysis put a specific number on it: each offshore day adds 0.06 points to the post-shift fatigue score. By day 14, that is almost a full point of subjective impairment over baseline — the difference between an alert derrickhand and one whose reaction time has drifted.
The clinical consequence is serious. A North Sea PMC study found 23.3% of swing-shift offshore workers meet shift-work disorder criteria, with the prevalence rising toward mid-hitch. Maritime injury law firms have also documented the liability exposure — one legal analysis explicitly cites mid-hitch fatigue as a factor in offshore incident claims. The day-14 trajectory is not anecdote. It is a curve an OIM can plan around.
Growing Safety Margin Like a Perennial Garden
The most useful reframing is to stop thinking of a 21-day rotation as a flat risk landscape and start thinking of it as a garden with seasons. Weeks one and three bloom. Week two is the dry stretch. Perennials that had full energy on day three are wilting by day 12 — predictably, measurably, as physiology, not personality. The OIM's job is not to replant, but to tend harder when the dry stretch comes.
Verdant Helm maps that garden against the same fatigue models the research relies on. A systematic review of shift and night work effects in offshore petroleum documents mid-hitch sleep debt, recovery timing, and risk amplification across rotation schedules — the exact inputs a biomathematical fatigue model uses. Inside the platform, each crew member's predicted state on each hitch day appears as a garden tile whose color shifts with the model's output. By day 10, the display is already predicting where day 14 will land, letting the OIM prune work intensity before the wilt happens instead of after.
That prediction matters because most rig work cannot be deferred — the well needs to be drilled, the trip needs to be made, the BOP needs to be tested. What can be changed is the sequencing. A critical lift scheduled for day 14 can be moved to day 10 if the garden indicator says week two is running hotter than average for this crew. The point is that the garden metaphor is not decorative. It gives the OIM and toolpusher a shared mental model for why day 14 matters and what the lever is — sequencing, not cancellation.
A second ScienceDirect review of North Sea shift schedules reinforces that rotation length drives both fatigue accumulation and incident-risk curves — not work intensity alone. The same crew at the same workload has a measurably different risk profile on day 14 than on day 4. The garden must be tended accordingly. Verdant Helm's model output feeds directly into the morning briefing, so the day-14 conversation is not a surprise — it is planned from day one.
The common-sense moves that follow are straightforward. Move BOP tests and high-consequence JSAs out of the day 12-to-16 window where possible. Extend handover windows from 12 minutes to 20 on days 10 through 16. Increase near-miss reporting review from weekly to twice-weekly during week two. Pair up a fresh week-one crew member with the derrickhand who is deepest into the hitch on any trip operation. None of these cost schedule. All of them cost discipline.
The Day 14 Heatmap
The heatmap view that Verdant Helm puts in front of the OIM on a 21-day rotation makes the trajectory unavoidable. Each day of the hitch is a row. Each crew member is a column. The cells shift from green through amber to red as predicted fatigue accumulates. By day 10, the red cells are already painting the picture of where day 14 will land. That preview is the intervention. The OIM does not have to guess whether to reschedule the trip-out-of-hole — the heatmap tells them.
The heatmap is designed to sit alongside the operations schedule on the same screen. A toolpusher dragging a planned BOP test from day 14 to day 10 can see the cells shift color in response — the drilling floor bed loses its worst red day, the deck team stays green, the marine team keeps its existing plan. That live response is what turns the heatmap from a passive report into a scheduling instrument. OIMs who have used it for three or four hitches describe reading it the way a weather officer reads a pressure chart — less as a forecast, more as a set of levers to pull.
Printed versions of the heatmap end up pinned in the doghouse and the mud logger's office within two hitches of rollout. The printed copy lags the live display by 24 hours, but it becomes the reference the toolpusher and derrickhand point at during the morning JSA conversation. A pinch-point JSA being reviewed on day 13 with the day-14 column showing amber across the deck team gets a second signature and an extended briefing. The same JSA reviewed on day 5 with a green column runs at the rig's normal cadence. That differentiation — same task, different garden — is what the heatmap makes routine rather than exceptional. Verdant Helm generates the printed copy automatically each morning so the paper and the screen stay aligned without additional administrative work for the HSE coordinator.
Advanced Tactics: Planning Against the Curve
Three tactics turn the day-14 curve from a problem into a schedule input. First, build the hitch schedule around the prediction, not around the drilling plan alone. A rig running a four-crew 14/14 rotation and a rig running a two-crew 21/21 have different curves, and the intervention points differ. The back-to-back crew changes post covers the stacking math.
The prior hitch matters too. A PubMed analysis of shift rotation, overtime, and sleep patterns documents how overtime and stacked rotations specifically worsen offshore sleep outcomes, so the schedule input has to account for the prior hitch as well as the current one. Accounting for both hitches separates a schedule that survives the curve from one that breaks on it.
Second, watch the handover. A 12-hour handover analysis goes deep on why day-14 handovers leak more safety signals than day-4 handovers.
The short version: fatigued crew-members give shorter, less specific handover notes. That measurable drop in handover quality is itself a leading indicator, and the rig can use it to calibrate the day-14 response. On high-performing rigs, the toolpusher reads handover-note length and specificity as a proxy for crew state.
Third, treat the trajectory as something a neighboring industry has to solve too. Offshore wind technician teams see the same inflection on a different cadence. The 1.5-meter sea-state crew-energy reset post describes how wind SOV crews use weather windows as natural reset points the same way drilling crews use day-one of a new hitch. Cross-industry pattern-learning speeds up the rig's own curve.
The common mistake is to plan around the calendar but not the curve. A toolpusher who schedules the most complex operation on day 14 because "that is when we finish the section" is fighting physiology. The drilling plan is harder to move than the crew schedule, but the crew schedule has more leverage on the incident trajectory. Verdant Helm shows both curves on the same screen so the trade-off is explicit, not hidden. OIMs who run three or four rotations through the platform learn to read the day-10 signal and act before the day-14 wilt confirms it.
A fourth tactic is to calibrate the curve to the specific crew, not to a rig-class average. Two crews running the same 21-day rotation on the same semi-sub can have measurably different day-14 trajectories — driven by age distribution, prior hitch recovery, leave patterns, and team composition. Verdant Helm's model learns the specific crew after three hitches and adjusts the prediction accordingly. A younger deck crew with a strong pre-hitch recovery window may not show a day-14 inflection at all. An older crew returning from a disrupted leave period may show the inflection on day 10. The curve is a starting point, not a destiny.
A fifth tactic is to teach the curve to the crew directly. Roustabouts and derrickhands who understand that the physiology peaks between days 12 and 16 treat their own rest, nutrition, and handover quality differently in week two. The IOGP 626-1 fatigue information sheets provide worker-facing material that makes the curve intelligible without clinical overload. Crews who see the curve in their own garden display own their own week two. The garden metaphor helps — a perennial that knows when the dry stretch arrives conserves water naturally.
A sixth tactic is to use the curve to protect ALARP documentation. When a hitch shows a textbook day-14 inflection with the anticipated interventions applied, the ALARP case for the rotation has a clean narrative. When the curve deviates — either because the crew aged or the weather disrupted rest — the deviation itself is documentation. Auditors reviewing the paper trail see a rig that understood its own curve and responded when the curve moved. That is a defensible posture. Rigs that cannot produce the curve or the response are in a harder argument.
CTA: For OIMs Running Rigs With Mid-Hitch Risk Windows
For an OIM or drilling supervisor watching the day-14 pattern emerge in your own incident reports, the next hitch is the place to test the intervention. Start by plotting the last two years of first-aid, near-miss, and permit-to-work exception cases against hitch day. If the curve rises between days 12 and 16, you have a trajectory — and a lever. Verdant Helm can import the IADC daily reports and surface the same curve in 24 hours. The review call is worth 30 minutes whether you pilot the full platform or not.
The prep that makes the review call productive is light. Pull the last three hitches of first-aid logs, the current crew manifest with hitch-days-in, the planned operations window for the next 21 days, and one prior shutdown record. Verdant Helm maps these against the fatigue model inside the first 15 minutes of the call, and the remaining time covers the intervention plan for the next hitch specifically — which operations to resequence, which handovers to extend, which crew pairings to alter. OIMs who come with the raw reports leave with a Monday-morning plan for week two. For drilling contractors operating a fleet of rigs, the same review can be run across rig classes in parallel so the day-14 curve is calibrated to each rig's crew composition and rotation pattern rather than a generic offshore benchmark. The garden principle stays constant; the bloom and wilt dates shift with the rig.