Hitch-End Decay Curves in Deepwater Drillship Crews
The Drillship Curve Is Not Just a Longer Jackup Curve
Four deepwater drillships in the US Gulf — three operating in 5,000-8,000 feet of water, one in 9,200 feet — were observed across 16 weeks of 2025, covering four full 28-day rotations. The 2025 IISE four-week GOM drillship fatigue assessments study independently documented declining PVT performance and sleep efficiency by week four of rotation in the same region. The decay pattern the garden rendered matched the published curve on shape but added rig-level detail that averaged studies necessarily smooth over.
The fastest way to miscalibrate is to assume a drillship decay curve is a stretched jackup curve. It is not. The IISE qualitative investigation of offshore drilling workers captured crews describing late-hitch cognitive decline in ways that varied distinctly by rig class. Jackups in shallow water show a near-linear accumulation across 14 days, then a sharp inflection in the final three. Drillships show a two-step curve — a first plateau around day 10-12 as the crew absorbs deepwater operational complexity, then a second acceleration from day 18 as absorption capacity exhausts. The garden makes the two-step visible.
What the Drillship Garden Shows Across 28 Days
Verdant Helm renders crew as a botanical garden. On a deepwater drillship the garden carries 140-180 perennials across six crews, substantially larger than a jackup's 76. The larger crew complicates the reading because bed-to-bed interference becomes a first-order signal rather than a secondary one. Across the four rotations, three decay-curve features appeared consistently.
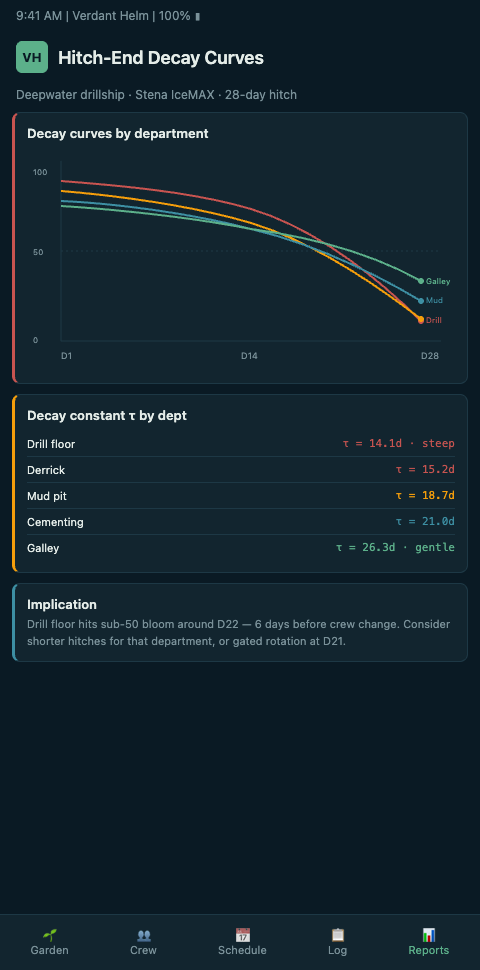
Feature one: the absorption plateau. Days 8 through 13 show stable bloom across most beds. The curve flattens. The operational complexity of deepwater drilling — managing riser tension, controlling ROV deployments, running BOP tests in deeper water — front-loads the hitch's cognitive demand. Crew that started the hitch at full bloom absorb that demand and stabilise. A manager reading the garden during this plateau and concluding "we are fine" is misreading. The PMC systematic review of effects of shift and night work in offshore petroleum documents that working-memory performance drops under sustained offshore shift cycles, and the drillship plateau is the phase before that drop becomes visible.
Feature two: the day-18 acceleration. Between day 17 and day 19, bloom drops visibly across the subsea and drill-floor crews simultaneously. Not because anything external has changed. Because absorption capacity has exhausted and each of the previous 17 days of demand now compounds. The Applied Ergonomics objective-vs-subjective operator fatigue paper shows that actigraphy captures objective hitch-end fatigue signals that subjective surveys miss — the day-18 acceleration is exactly the kind of signal the crew will not self-report but the garden renders.
Feature three: the asymmetric bed pattern. On a jackup, late-hitch wilt tends to spread uniformly across the drill floor. On a drillship, the wilt concentrates in the subsea crew first, the drill floor second, the marine crew third. That sequencing reflects the division of cognitive load on deepwater operations. The subsea crew carries the most novel complexity and depletes first. A supervisor who rotates deck tasks without considering this sequencing will move tired subsea crew into rested drill-floor roles and miss the underlying pattern.
Why the 28-Day Rotation Amplifies the Curve
Deepwater drillships typically run 28/28 rotations rather than the 21/21 common on jackups. The extra week is not free. It does three things to the decay curve that operators frequently underestimate.
First, the absorption plateau stays intact — the crew can absorb up to roughly day 13 regardless of whether the rotation runs 21 or 28 days. But the acceleration phase lengthens proportionally. A 28-day hitch delivers 10 days of declining performance against a 21-day hitch's three. That is not a 33% difference. It is a more-than-3x difference in cumulative fatigue exposure during the declining phase.
Second, the recovery period between hitches does not scale with the working period. A 28-day hitch followed by 28 days off produces more residual fatigue at the start of the next hitch than a 21-day hitch followed by 21 days off. The IOGP Managing Fatigue guidance documents the non-linear nature of rotation-related fatigue accumulation, and the asymmetric recovery is a well-studied aspect of that non-linearity.
Third, the global drillship fleet is operating near its utilisation ceiling. The Westwood Insight US Gulf drillship fleet analysis reports 82 committed units in February 2025 at 93% marketed utilisation, which sizes the deepwater crew-fatigue exposure at roughly 12,000-14,000 active crew members worldwide. Decay-curve insight at this scale is not a single-rig conversation.
What the Four-Rotation Overlay Revealed Across the Four Rigs
Running the garden across four drillships for 16 weeks produced enough data to compare the curves rig-to-rig. Three distinct shapes emerged.
The shallowest-water drillship of the four — operating in 5,000 feet — showed the flattest curve. Its absorption plateau extended longer (through day 14) and its acceleration phase started later (day 19). The shape looked more like an elongated jackup curve than a distinct drillship curve. Operationally, the rig ran simpler programmes with fewer subsea complications, which the data reflected.
The two mid-depth drillships (6,500 and 8,000 feet) produced nearly identical curves. Both showed the classic two-step pattern — plateau around day 11, acceleration from day 17. The curves overlapped within one standard deviation despite different operators, different contractors, and different well programmes. This convergence suggests that mid-depth drillship operations impose a common cognitive load shape, independent of operator or contractor variation.
The 9,200-foot drillship produced the sharpest curve. Earlier plateau exit (day 10), steeper acceleration (starting day 15), and more concentrated final-week wilt. The ultra-deepwater complexity compressed the entire decay pattern by three to four days relative to the shallower rigs. If the 8,000-foot curve is the drillship-class median, the 9,200-foot curve is the warning that ultra-deepwater crews cannot be scheduled against drillship norms. They need their own baseline.
The findings have two practical implications. First, drillship decay curves should be baselined per-rig, not per-class. Second, water depth is the single strongest predictor of curve shape among drillships — stronger than operator, contractor, or programme complexity.
Advanced Tactics: What Drillship OIMs Do With the Curve
OIMs and drilling supervisors running deepwater drillships on 28-day hitches have three specific interventions the garden enables that jackup OIMs generally do not need.
First, plan BOP tests and other cognitively-loaded activities before day 17, not after. Crew absorption capacity peaks during days 8-13 and is stable through day 16. Pushing complex low-frequency tasks into this window — at the cost of scheduling convenience — pays back across the back third of the hitch. Mindfulness on the Rig coverage from SPE JPT documents that workers report less emotional exhaustion when daily practices are in place, which is a complementary tactic during the back third.
Second, rotate subsea-crew assignments starting at day 14, before the acceleration begins rather than after wilt is visible. The garden's bed-level view shows which subsea crew members still carry absorption capacity and which have begun to deplete. The OIM can rebalance work before the asymmetric wilt becomes operational risk. This requires accepting that subsea crew rotation is a hitch-midpoint activity, not a hitch-end one.
Third, track the curve month over month. The four-rotation overlay reveals whether this hitch is running ahead of or behind the rig's historical curve. A rotation 20% below baseline at day 16 is a different operational state than one matching baseline.
For the statistical scale-up, see the 10,000-hitch rotation dataset.
For the pre-demob decision window from the 21-day-rotation side, see the six-days-out burnout signals.
The deepest tactic is recognising that decay curves generalise across maritime operations.
The floating wind intensity spike modeling discussion shows how similar curve-based reasoning applies to wind technician teams working in comparable deepwater conditions. A drillship OIM who reads that piece may find familiar mechanics described in a different industry vocabulary.
The Curve's Implications for Rotation Policy
Drillship rotation policy has been locked at 28/28 for most operators for more than a decade. The decay curves documented across these four rigs raise a specific policy question: if the acceleration phase accounts for a disproportionate share of hitch-end fatigue exposure, is 28/28 the right default? The question is not rhetorical.
Two alternatives are worth examining. First, 21/21 drillship rotations truncate the hitch before the acceleration phase fully develops. The tradeoff is logistics — 50% more crew changes per year, with associated helicopter, scheduling, and onboarding costs. For ultra-deepwater operations where the curve compresses, the tradeoff may favour 21/21 even before safety considerations enter the calculation. For mid-depth drillships where the curve is longer, 28/28 remains defensible.
Second, fatigue-gated rotations flex the demob date around a nominal 28-day window. The crew that tracks above baseline may extend by 48 hours; the crew that tracks below baseline may demob 24 hours early. This approach treats the calendar as a default rather than a hard boundary. A handful of rigs have piloted this model; early results suggest it captures most of the operational flexibility without the full logistics overhead of shorter rotations. The curve data across these four drillships would support a pilot; the question is which operator moves first.
Bringing the Curve Into the Daily 06:00 Call
Drillship OIMs should add the day-in-hitch garden curve to the 06:00 operations call starting with the next rotation. One slide: current day in hitch, position on the decay curve, deviation from the rig's four-rotation baseline, decisions for the next 12 hours. Verdant Helm generates this slide automatically from the underlying garden state. Book a 40-minute review with us and bring the last four rotations' worth of hitch-end data — we will render the curve overlay and identify the two highest-leverage shifts for the next 28-day hitch.
The slide becomes a morning anchor within three or four days of use. The OIM points at the curve position during the call and the toolpusher reads the deviation aloud — two sentences added to the operations briefing that reshape the day's planning. Drillship OIMs who have kept the slide in the 06:00 rotation across a full hitch report that the subsea crew's week-three fatigue exposure drops visibly because the supervision conversations that used to happen after a near-miss now happen before one.