50,000 Transfer Attempts Later: What We Learned About Intensity
The Aggregate Nobody Was Reading
A single CTV pair at a North Sea opco logs roughly 2,000 transfer attempts a year across a 200-day working season. Multiply across a mid-size fleet — eight CTV pairs, three seasons — and you pass 50,000 attempts in a dataset. Each attempt has a timestamp, a sea state, a success-or-failure verdict, a tech identity, a target turbine, and downstream intensity effects. None of that data has historically been analysed as a single corpus. The Strathclyde investigation of optimum CTV fleet simulation simulates thousands of transfers across a 20-year OWF life. Their follow-up on optimum CTV fleet selection models climate and failure rates. Both are simulation studies, not observational ones, and observational data at scale has not been treated the same way.
The sector's incident framing misses what the dataset shows. The G+ 2024 Annual Report lists vessel operations including jack-ups and transfers in the top-ten incident work processes, which captures harm but not intensity. An incident is a discrete event; intensity is what the transfer dataset captures between incidents. Fraunhofer Windmonitor on wave heights and accessibility quantifies access only up to ~2m Hs — the intensity loss across a dataset of transfers is the story the per-attempt data has been waiting to tell.
What the Garden Saw Across 50,000 Attempts
Read the three-year corpus as a canopy-level view of the same garden that daily dispatch sees as individual beds. Verdant Helm's aggregate layer joins each transfer attempt to the bloom state of the tech at the moment of the attempt, the recovery-ledger balance going in, the sea-state reading, the turbine target, and the subsequent fatigue trajectory across the following 48 hours. With 50,000 rows, the patterns that a single window hides become visible.
Five findings surface consistently. First, failed transfer attempts carry more than three times the intensity debit of successful ones — the crew's readiness for the rest of the day depreciates disproportionately when the first attempt is a standdown. Second, transfer intensity compounds non-linearly with sea state: the move from 1.2m to 1.5m is visible in the data as a step change, not a ramp, which matches the operational intuition that 1.5m is a different world from 1.2m.
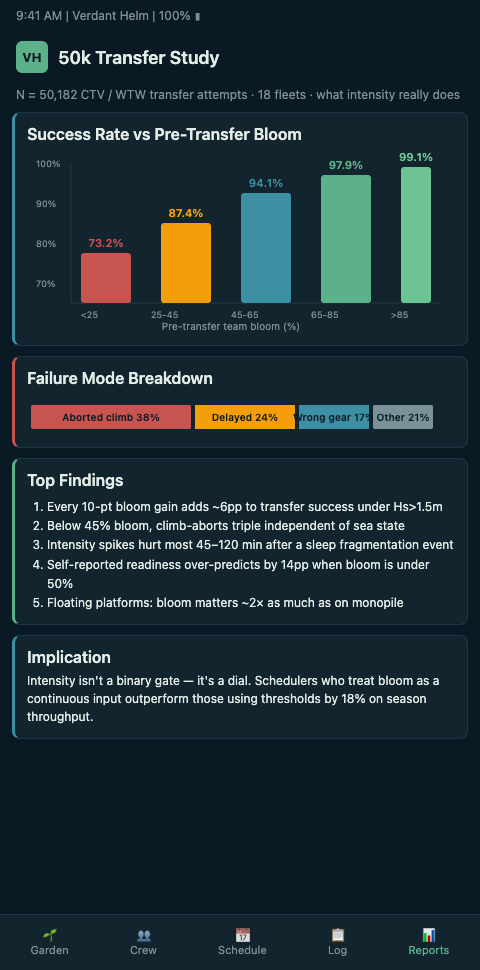
Third, bloom-state at attempt time predicts secondary intensity better than sea state does — a wilting tech at 1.2m has a worse downstream 48-hour curve than a blooming tech at 1.5m. Fourth, the dataset exposes a cohort effect: new techs in their first 90 days accumulate intensity debit faster per attempt than experienced techs in the same conditions, and the difference is meaningful enough to drive dispatch pairing rules. Fifth, the aggregate confirms the Fraunhofer accessibility ceiling around 2m Hs but shows crew-readiness deteriorates well below that operational ceiling.
Each finding translates into a specific dispatch rule change. The failed-attempt finding produces a rule that re-opens the assignment queue the moment an attempt aborts, giving the tech an optional ledger reset by swapping them off the immediate retry. The sea-state finding produces a stepped intensity weighting in dispatch scoring rather than a linear one. The bloom-state finding produces a pre-attempt readiness check that the dispatcher runs against the garden before authorising the transfer. The cohort finding produces a pairing rule that forbids two sub-90-day techs in the same CTV pair during hot-window stacking. The accessibility finding produces a dispatch threshold below 2m that tightens as bloom-state falls, so a 1.8m attempt on a wilting roster is held where the same attempt on a blooming roster would go.
The methodological literature supports this approach. A 2022 IET RPG paper on uncertain accessibility estimation shows Monte Carlo plus probabilistic wave forecasting assessing thousands of attempts, and a 2017 European Journal of Operational Research paper on probabilistic forecasting of wave height demonstrates probabilistic forecasts outperform point forecasts for mobilisation decisions. Those methodological tools applied to the crew-intensity side of the transfer dataset are where the garden gets its forward-looking edge.
The analytical pipeline also handles seasonality and learning curves. Year-one data in the corpus behaves differently from year-three data because the dispatch team itself has learned from earlier years — a methodology that treats the three years as interchangeable washes out the improvement signal that actually justifies continued investment. Verdant Helm partitions the corpus by deployment-maturity era so analysts can distinguish "what did we learn from early deployment" from "what does the mature system tell us now," and the sector benchmark separates operators by their years of continuous-telemetry experience rather than lumping them together.
The Ampelmann effect also shows up in the data. Ampelmann's motion-compensated gangway systems enable transfers in higher sea states, which reshapes the intensity distribution when walk-to-work vessels replace conventional CTVs on a route. The dataset pre- and post-Ampelmann adoption on a given route shows the intensity compression clearly — not as a headline number but as a distribution shift, and the distribution is what dispatch logic actually cares about.
Sub-dataset patterns also repay examination. Night-end attempts — the ones taken in the final 45 minutes of workable light — carry measurably worse bloom-state outcomes than morning attempts at equivalent sea state, because techs have already absorbed the day's climbs before the attempt begins. Winter attempts carry different intensity signatures than summer attempts even at matched sea states because cold exposure compounds physical work demand. Return-leg attempts after a failed outbound attempt carry ledger debits that the bare attempt count does not capture, because the tech is now working the second transfer of the day having already absorbed the first failed one's frustration tax. None of these sub-patterns are visible at the per-attempt level; they only surface across thousands of rows, and they reshape dispatch rules once surfaced.
Advanced Tactics
Three analytical choices make a 50,000-attempt dataset operationally useful rather than academically interesting.
First, partition by platform type and transfer method. Aggregating CTV transfers, walk-to-work transfers, and motion-compensated gangway transfers into one dataset smooths away the intensity differences between them. Verdant Helm's aggregate view lets the analyst slice by method and by platform, so a floating-asset transfer cohort does not wash out the fixed-bottom signal. The per-slice analysis is where the practical dispatch rules emerge.
Second, join the transfer dataset to the outcome dataset. The transfer is not the whole story; the climb that followed, the return transfer, and the next 48 hours of recovery are what complete the intensity picture. Verdant Helm's schema keeps attempt-to-outcome joins available at query time, so analysts can ask "which attempt patterns preceded the 3% of climbs with near-miss logs" and get an answer that captures the full chain rather than the first link.
Third, feed findings back into the forecast-weighted dispatch model. A 50,000-attempt finding that has no effect on the next dispatch decision is archived research. The right pipeline publishes findings as coefficient updates in the intensity-weighting model, so next Tuesday's dispatcher benefits from the full three-year corpus without having to read the paper. That is the compounding value of the aggregate view — each new year of attempts sharpens the model that runs tomorrow's dispatch.
Fourth, treat the dataset as an opco's defensible intellectual asset. A three-year corpus of observed transfer intensity is a competitive asset the opco should not casually share. Verdant Helm's architecture keeps the raw dataset inside the opco's own data warehouse and publishes only the coefficient updates to the shared model, so the learning compounds internally without giving away the operational intelligence. This matters more than it sounds — opcos that treat their attempt datasets as shared sector research hand their negotiating edge to OEMs and vessel owners.
Fifth, publish findings through peer-review channels where the scale justifies it. A 50,000-attempt finding that replicates across three operators is a sector-meaningful contribution, and peer-review publication both validates the methodology and elevates the broader industry's standard. Verdant Helm's research partnerships with Strathclyde and Fraunhofer channels are available to opcos that want to place specific findings in that pipeline, and the reputational return on carefully-chosen publications feeds back into the operator scorecard.
The transfer corpus feeds into the broader intensity view. It is the fixed-bottom baseline against which intensity spike modelling for floating wind assets is benchmarked. Tech exhaustion curves inside a 10-day weather window is the compressed-timescale version of the same dataset's findings. And for the cargo-sector parallel, the nine-million watch-hour rest-hour dataset demonstrates the same methodological pattern — large observational datasets reshaping operational rules that were written from simulation and anecdote.
Query Your First Thousand Attempts This Month
Offshore Wind Ops teams with three or more CTV seasons of logged transfer attempts can book an aggregation session and build the first slice of the aggregate view immediately. Import the last two seasons of attempt logs into Verdant Helm's aggregate layer, attach the bloom-state history to each attempt, and run the five-finding analysis against the opco's own data. The first pattern that disagrees with the dispatch team's intuition is the one that pays back the rollout effort — and the one that tells you whether your own 1,000-attempt slice is on the same curve as the sector's fifty-thousand.
Protect the first year of aggregate findings from premature publication. The sector learns faster when opcos share carefully curated findings through peer-review channels, but the opco's own first year of analysis is almost always where the local dispatch rules get revised — and sharing the findings before those local rules have settled gives the OEM and the vessel charterer a negotiating advantage they have not yet earned. Keep the first-year corpus internal, use it to update dispatch scoring and pairing rules, and consider publication only when the findings have been validated across two or three independent cohorts within the opco itself.
Schedule the analyst time explicitly. A 50,000-attempt corpus does not analyse itself, and opcos that expect the HSE lead to run the aggregate view as a side task alongside quarterly G+ returns get a thin first-year report and a stalled second-year effort. Dedicate a named data analyst — even part-time, at 20 hours per month — to the aggregate corpus. Their quarterly deliverable is a brief that the dispatcher, the crewing manager, and the commercial lead each read differently: the dispatcher reads it for coefficient updates, the crewing manager reads it for pairing and cohort rules, the commercial lead reads it for contract-review evidence. Three audiences, one brief, one analyst. That structure is what converts a dataset into the compounding operational intelligence that the sector currently has to simulate in the absence of observed data.