G+ Safety Dashboards Fed by Energy Telemetry
The Quarterly Reconstruction Problem
Every quarter an HSE lead at a G+ member opco sits down with a spreadsheet, an incident database export, and a coffee that gets cold. The job is to reconstruct twelve weeks of near-misses, LTIs, medical-treatment cases, and work-process categories into the format the G+ Power BI statistics dashboard expects. The incident log is a set of forms filled in days or weeks after the event. The work-process tagging has drifted across phase leads. The categorisation of "fatigue-contributing" is editorial. The return goes in. The benchmark that comes back — the 2024 G+ Annual Report logged TRIR 2.93 up 7%, LTIF 1.27 up 19%, across 78.8 million hours worked — is only as trustworthy as that reconstruction.
The sector's own reporting confirms the gap. The Energy Institute's reading of the 2023 data noted 1,679 incidents across 61.9M hours with mixed performance. Energy Voice reported a 94% rise in offshore wind safety incidents year-over-year as the sector scaled. Modern Power Systems' analysis of the same figures flagged the benchmark utility of G+ data while noting the reporting gap between opcos. The Energy Institute's release on injury rates rising with growth makes the volume problem explicit, and every HSE lead across the G+ member base recognises that the reconstruction-driven return is the reason their own opco cannot yet read its own safety data at the cadence the industry's pace now demands.
Feeding the Dashboard From a Living Garden
The gap between operational data and regulatory submission costs the sector real money. HSE leads spend tens of hours per quarter on reconstruction work that adds no operational value. Inconsistent tagging across phase leads means roughly 10-15% of events get re-categorised in the final return versus how they were initially logged, introducing drift that propagates through sector analysis. Late-event additions — incidents logged weeks after occurrence because a tech remembered a near-miss mid-rotation — create timing ambiguity that makes monthly sub-cycle analysis unusable. The reconstruction model is functional but structurally expensive, and the cost falls almost entirely on the HSE function that is also expected to drive forward-looking safety improvement.
Treat the G+ return as the annual photograph of a garden that Verdant Helm already tends day by day. If the garden is planted properly, the photograph assembles itself. Each tech bed carries a continuous state: bloom colour, recovery ledger, near-miss annotations, logged transfer attempts, CTV and SOV berth occupancy, wearable-aggregate signals. Each incident the opco would have reported quarterly is already attached to a bed at the moment it happens, tagged to the correct work-process category, linked to the fatigue context it sits inside. When the quarterly return drops, the HSE lead's job changes from reconstruction to review. The data is already shaped.
The NREL KPI framework for operational offshore wind data provides a template for the integration: defined KPIs for availability, performance, and reliability that the industry has standardised around. The crew-energy layer slots in as a parallel set of KPIs — bloom-state distribution, wilt-event count per window, recovery-ledger variance by rotation — that the G+ dashboard can host alongside the existing safety KPIs without breaking the taxonomy. Verdant Helm maps its internal signals to the G+ work-process categories at ingest time, so by the time any event lands in the opco's incident database it is pre-tagged for the annual return.
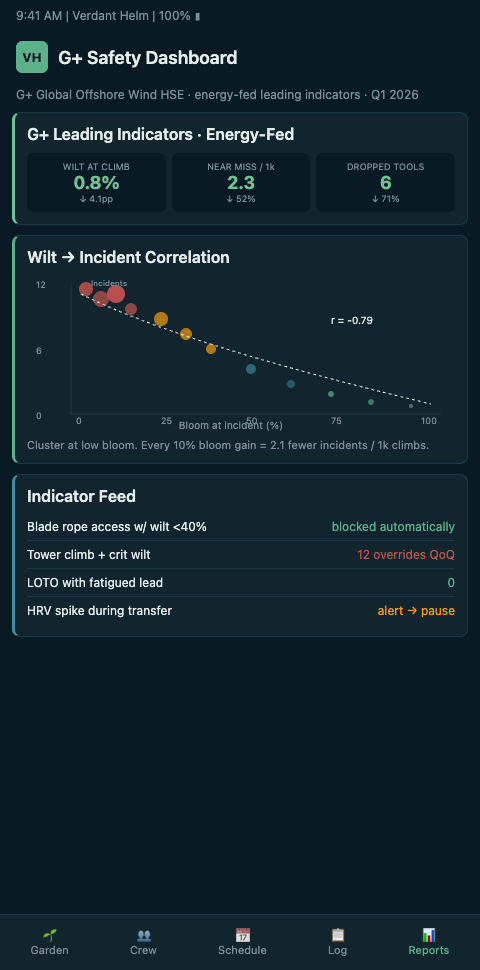
The continuous feed also enables leading-indicator analysis that the quarterly reconstruction cannot. A dashboard that shows rolling 30-day bloom-state density alongside rolling 30-day incident rates produces leading-indicator correlation that becomes visible months before the annual report confirms it. Opcos with continuous feeds can adjust operational policy in response to early signals rather than waiting for the annual TRIR print to move. The analytical capability this unlocks — forward-looking safety management rather than retrospective reporting — is the structural shift the G+ dashboard has been ready for but could not achieve on the old data-collection model.
What the dashboard gains is contextual density. An LTI event reported in the old format is a date, a location, a work-process category, and a narrative. The same event reported from energy telemetry is all of that plus the bloom state of the attached tech for the preceding 14 days, the weather window that was being worked, the transfer attempt count that week, the wearable HRV trend, and the recovery-ledger balance. Sector-level analysis can now ask: do LTIs cluster on day six of stacked windows, and in what bloom-state distribution? That question was not answerable from the reconstructed return. It is answerable from the continuous feed.
Cross-opco benchmarking gets sharper too. A G+ return drawn from continuous telemetry lets the industry separate opcos whose incident rates reflect actual operational risk from those whose rates reflect reporting discipline differences. Under the old reconstruction model, an opco that reported every near-miss looked worse than an opco that reported only the ones that couldn't be hidden, even if the second opco's actual risk exposure was higher. Continuous feeds narrow this distortion because the bloom-state context around each event becomes machine-readable, and outlier reporting patterns become visible in a way they never were under the manual return.
The latency gap also collapses. Under quarterly reconstruction, the sector-wide signal from an incident pattern surfaces nine to fifteen months after the underlying dynamic took hold. Continuous feeds shrink that to four to six weeks on a rolling monthly window, which means opcos can adjust operational policy before the next annual report prints rather than after the fact. Policy changes responding to a pattern visible only in hindsight are always one cycle behind; policy changes responding to a pattern visible in near-real-time can actually change the next year's numbers.
The feed also closes a reporting trust gap. G+ statistics have always carried a "we think this is the picture" caveat because reporting discipline varies across members. When the feed is continuous and pre-tagged, the cross-opco comparison sharpens — an opco with consistent bloom-state reporting standards can be benchmarked against one with sparser signals, and the dashboard can show that distinction rather than averaging it away.
Advanced Tactics
Three integration choices decide whether an energy-telemetry feed to G+ actually shifts sector benchmarking or stays as a dashboard novelty.
First, standardise the bloom-state schema before negotiating the feed. G+ data has been useful because the work-process taxonomy is shared across members. A crew-energy feed that uses opco-private colour scales produces incompatible signals. Verdant Helm ships a reference bloom-state schema aligned to G+'s categories, and opcos on the platform write to that schema by default. The first six opcos to feed continuously establish the effective standard for the next sector-wide benchmark, so schema discipline at rollout time pays back disproportionately.
Second, separate the operational feed from the regulatory return. Day-by-day bloom and dispatch decisions need low-latency data. The G+ quarterly return needs stable, auditable, period-closed data. Verdant Helm runs the same inputs into two views: a hot operational view the dispatcher uses live, and a period-locked archive the HSE lead submits from. Both come from one garden. Neither pretends to be the other.
Third, publish the telemetry-feed methodology. The G+ benchmark is only as valuable as its comparability, and the industry will only trust a continuous-feed return if the underlying methodology is transparent. Opcos that publish their signal definitions, data-retention rules, and bloom-state thresholds alongside the return earn the trust that makes the benchmark actionable. Opacity here undermines the same data's safety case downstream.
Fourth, build the member-to-member interoperability layer early. G+ membership will eventually include opcos using different crew-telemetry platforms, and a feed architecture that only works with Verdant Helm-fed opcos produces a dashboard that splits the sector rather than benchmarking it. The right design publishes a G+-owned schema specification that any telemetry platform can conform to, so the feed becomes platform-independent. Verdant Helm advocates this path because a broader feed base makes the benchmark more useful — and because sector-wide adoption of continuous reporting is worth more than single-vendor lock-in.
Fifth, align the feed's publication cadence with the HSE review cycle of G+ members. Monthly snapshots feed the monthly HSE reviews at individual opcos. Quarterly aggregates feed the G+ committee work. Annual archives feed the board-level reporting and sustainability filings. Each cadence has its audience and each needs its archive discipline. A feed architecture that only publishes annually misses the operational audiences; one that only publishes in real time overwhelms the strategic ones. Three distinct cadences, three distinct views, one shared source of truth.
The G+ feed is one node in a larger stack. It sits downstream of continuous fatigue streams in wind O&M — the operational stream feeds the regulatory dashboard — and upstream of fatigue-weighted SLAs in offshore wind O&M contracts, where the same data starts reshaping commercial terms. For the maritime benchmarking parallel, CLIA seafarer welfare reports fed by garden data maps the identical pattern to the cruise sector's annual welfare benchmark, and the lessons from one sector shorten the integration timeline for the other.
Wire Your Next G+ Return Continuously
Offshore Wind Ops HSE leads preparing the next G+ return can book a scoping call and stand up a parallel continuous feed this quarter. Configure Verdant Helm's G+-compatible schema, route bloom-state events and near-miss submissions into the pre-tagged archive, and compare the machine-assembled return against the manual reconstruction for one quarter. The first time the two returns disagree on work-process categorisation is the conversation that shifts the annual report from retrospective to contextual — and the moment the dashboard stops being a photograph and starts being a feed.
Run the parallel comparison for two full quarters before proposing the switchover. One quarter shows the delta between the machine-assembled and manually reconstructed returns; two quarters shows whether the delta is stable across rotations or fluctuates with operational context. HSE leads who propose the switchover after one quarter sometimes discover in the second quarter that the bloom-state feed had been miscategorising a work-process that was unusual in the first three months but routine in the next three. A two-quarter parallel is cheap insurance against a taxonomy mismatch that would undermine the switchover's credibility with the G+ committee.
Bring the G+ committee liaison into the comparison conversation early. The opco's continuous feed is of limited value if the sector committee does not endorse the methodology, and the liaison is the natural bridge between internal comparison data and sector-wide schema negotiation. A quarterly written summary of the comparison — delta by work-process category, tagging discrepancies, reconstruction-to-feed variance — becomes both the internal audit artefact and the external evidence for the committee's methodology discussion. HSE leads who run this conversation as a two-way exchange with the committee find the schema questions land as collaborative rather than unilateral, which is the political posture the feed needs if it is going to extend beyond one opco's dashboard into the next version of the sector benchmark.