Near-Miss Reports That Map to Fatigue Troughs
The Problem: Near-Miss Reports Live in a Different Folder Than Fatigue
G+ has published anonymised offshore wind incident statistics since 2013, and the 2023 dashboard logged the now-quoted 94% jump in reported incidents against a 39% growth in exposure hours. The Health4Wind reading of that gap points at fatigue-linked precursors; the Steel Toe analysis of the 2024 G+ report adds speak-up culture and 12-hour shift compression. The reports exist. What does not exist, in most operator workflows, is the overlay that reads them against the fatigue signal from the same days.
The August 2023 cluster at the G+ member operator ran through standard near-miss channels — three slips on boat-landings during transfers that cleared the sea-state check at 1.25m Hs, two dropped objects from the gearbox platform on a Siemens Gamesa SG 8.0-167 fleet, one hatch strike on descent from a Vestas V164 nacelle. Each report got filed, each got a case number, each got a corrective action in the operator's safety ledger. The corrective actions were sensible at the report level: PPE review, tool tethering reminder, hatch-hinge inspection.
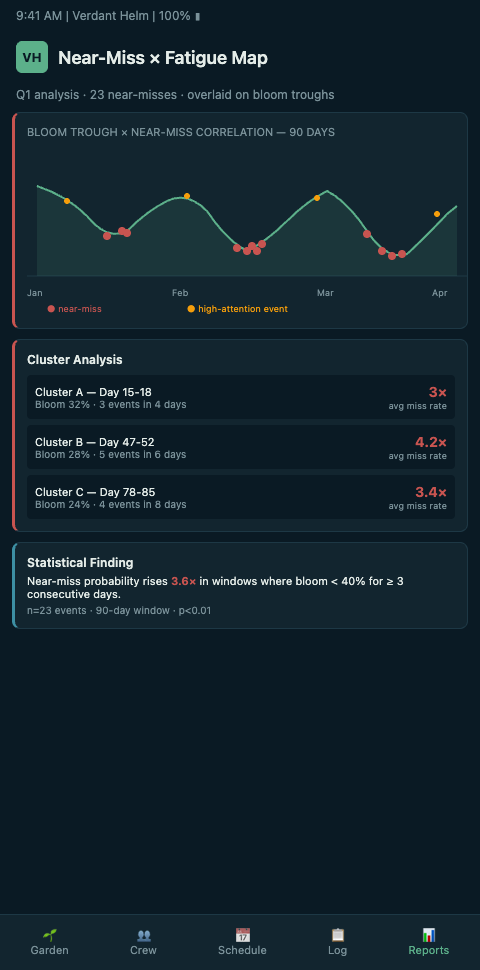
Read against the crew garden for those 11 days, four of the six reports landed in the same 48-hour trough — a cluster where three blade pairs and one gearbox specialist had been running back-to-back climbs through the heaviest part of the workable window. The PubMed field-based longitudinal study of multimodal fatigue in offshore shiftwork — 70 workers, 14 days, HRV + PVT + KSS — shows exactly this pattern: fatigue surfaces as a clustered signal, and near-misses track the cluster. The PNAS post-night-shift near-crash data makes the same point at the individual level.
The operator's report folder and the operator's fatigue folder never met. The reports got closed out as independent events. The cluster got coded as "busy season," which is the coding that guarantees the same cluster will appear in the next hot window. The gap is structural — near-miss and fatigue run on different tools, different owners, and different cadences, and the overlay is whose job exactly nobody is sure.
The Solution: Plant the Near-Miss Reports in the Garden
Verdant Helm imports the near-miss stream into the same plot as the crew garden. Each report becomes a pin on the garden timeline — date, vessel, turbine, category — and the pin is visible against the bloom state of the techs who were on that field, that CTV, and that turbine at the reported moment. The overlay is not a separate dashboard. It is the same dashboard the dispatcher uses for the morning brief.
Near-misses read as wilted-petal events on the garden. A slip on a boat-landing is a petal that came off during a transfer; the dashboard shows which perennial it came off, which bloom state that perennial was in, and which other perennials in the bed were at similar bloom states at the same moment. A dropped object from the gearbox platform is a ground-litter event near a specific bed; the garden shows which perennials shed it and whether the shedding correlates with the bed's watering history — watering, in this metaphor, is rest, hydration, task spacing.
The garden framing gives the safety lead a vocabulary that the anonymised G+ dataset does not supply on its own. Instead of tabulating six reports as six events, the lead tabulates them as three bloom-state patterns — which perennials were wilted when, which beds were under-watered, which sinks (the low corners where fatigue pools) were full. The Fatigue Science analysis of variable-schedule workers — the finding that 50-60% of their time sits at risk-level fatigue — is what the garden quantifies in real time instead of in retrospective FRA datasets.
The PMC review of sleep loss and shift-work disorder establishes the physiological base: circadian disruption reduces alertness, degrades decision quality, and elevates incident precursors. The garden shows that base as a live readout rather than a literature citation. When a near-miss pin drops on an amber bed, the dashboard flags the bed, the blooms, and the watering schedule in the next hour. The corrective action stops being "remind all techs about tool tethering" and starts being "reduce climb load on the H-series rope team for 48 hours and reseat the gearbox specialist rotation."
The G+ Learning From Incidents workstream is already designed around pooled cross-operator learning. Verdant Helm feeds that workstream on the operator side — the operator's near-miss data flows into G+ with the bloom-state tags attached, which makes the pooled dataset sharper and the industry-wide signal cleaner. This is the integration path that turns the 94% jump from a headline into a model.
The nacelle safety playbook for borderline-energy days gives the operational side of the same pattern, and fatigue cost of a failed transfer covers the upstream event where a wilted-perennial cluster typically first surfaces before the incident. For offshore oil and gas teams working a parallel problem, dropped-object precursors as energy dips covers compatible ground from the drilling side.
Advanced Tactics
Four extensions carry the overlay beyond basic correlation. The first is the precursor-distance metric. A near-miss is a leading indicator only if you measure its distance from the incident it could have been. Verdant Helm assigns a severity-potential score to each pin based on the task, the height, the adjacent PPE status, and the bloom state of the involved tech. A slip on a boat-landing by a green-bloom tech at 0.8m Hs is a different precursor than the same slip by an amber tech at 1.3m Hs on a CTV bow fender; the metric treats them differently and drives different correctives.
The second is the cluster-window alert. When three or more wilted-petal events land inside a 72-hour moving window on the same garden, the dashboard auto-escalates to the O&M manager and the G+ rep. The escalation is not a nag; it is a structured trigger that says the bed needs watering before the next transfer. The PubMed multimodal-fatigue study gives the statistical basis for the threshold; Verdant Helm ships it with a default that operators can tune to their site profile, whether a 100-turbine Dogger Bank cluster or a 30-turbine Taiwan Strait demonstrator.
The third is the rotation-level retrospective. At the end of each rotation — 14/14, 2-on/3-off, or the 21-day SOV cycle common on Hornsea 3 walk-to-work operations — the tool generates a rotation retrospective that shows the garden trajectory across the rotation, the near-miss pins that landed, and the bloom-state patterns that preceded each pin. The retrospective is the artifact the safety committee reads, replacing the anonymised-event summary that cannot see the bloom layer. Ørsted's published LTI-reduction work on leading indicators at Hornsea is exactly the kind of operator pattern this retrospective makes auditable. Floating-wind operators on Hywind Tampen and Kincardine run a parallel version, where the retrospective also tracks floater motion signatures against the bloom trajectory.
The fourth is the cross-operator benchmark. Because G+ already pools incident stats across members, Verdant Helm can anonymise the bloom-tagged near-miss stream and return a benchmark — your operator's bloom-state distribution of near-misses versus the pooled industry median. That benchmark is the conversation that moves a safety program from reactive case-closure to proactive bed-watering. The Health4Wind 94% analysis and the Fatigue Science schedule-variability work both point at this benchmark as the missing tier in offshore wind safety reporting.
The fifth extension, which operators typically layer in after six months of overlay data, is the failure-mode tagging. Not every near-miss is a generic slip. A dropped object from the gearbox platform on a GE Haliade-X has a different mechanical footprint than a hatch strike on a Vestas V164; the tagging separates them so the garden retrospective does not smear signals that need different correctives. A CTV boat-landing slip at 1.3m Hs in a cross-swell clusters differently from a walk-to-work gangway slip off an SOV in a 2m quartering sea. Verdant Helm attaches each pin to a failure-mode code drawn from the G+ incident taxonomy, and the bloom-state retrospective splits by code. Over a 90-day window, that split is where the operator sees which failure modes track fatigue most tightly and which track equipment or weather, which are different root-cause conversations with different owners in the operator's safety org.
Overlay Your Near-Miss Ledger This Quarter
If your near-miss reports are still closing out as independent events, your next hot window has a cluster already queued up. The Verdant Helm team runs a 60-minute overlay workshop — pull your last 90 days of near-miss reports, we reconstruct the bloom curves from your shift and transfer logs, and we show you the pins that would have flagged as cluster precursors on the garden view. Offshore Wind O&M safety leads, G+ member operator reps, and SOV HSE officers use the same workshop format. Most walk out with two bloom thresholds and one cluster-alert setting they can pilot in the next rotation cycle.
Citations:
- G+ Learning From Incidents Workstream
- G+ Health and Safety Statistics Dashboard
- PubMed: Field-Based Longitudinal Evaluation of Multimodal Worker Fatigue in Offshore Shiftwork
- PNAS: High Risk of Near-Crash Events Following Night-Shift Work
- PMC: Sleep Loss and Fatigue in Shift Work and Shift Work Disorder
- Health4Wind: The 94% Problem — Why Offshore Wind Safety Is Spiraling
- Fatigue Science: Schedule Variability Linked to Fatigue and Human Factors Incidents