Grove Dashboard Workflows During 72-Hour Hurricane Watch Windows
The 67-Hour Fatigue Trap
When the NHC issues a hurricane watch at the 48-hour mark and a warning at the 36-hour mark — per Potential Tropical Cyclone Advisory criteria (NWS) — grove managers enter an incident window where every decision compresses. A Collier County operation walked us through their Hurricane Ian experience: 67 hours awake, four team members, 14 blocks across 400 acres, and a dashboard that alerted on every telemetry deviation with equal urgency. The critical 8 PM advisory on Day 2 pushed a track shift east by 40 nautical miles, but nobody on the team caught it in the alert stream because three irrigation-sensor battery warnings fired at the same time.
The 40-nautical-mile shift moved their primary Murcott blocks from Tier 2 (selective early harvest on windward rows) to Tier 1 (full early harvest immediately). Inside the shifted cone, they had roughly 28 hours to pull 6,800 boxes of Murcott that they had planned to hold. They got 4,100 boxes pulled before outer bands reached the grove. The other 2,700 boxes rode out the storm on the trees, dropped at a 55 percent rate, and salvaged at commodity juice-plant pricing. The post-storm retrospective pinned the direct cause on the dashboard: three battery warnings arriving at the same priority as the advisory shift.
Hurricane Preparation and Recovery: Key Points (Citrus Industry Magazine) documents the problem: personnel assignment gaps at the 72-hour mark drive post-storm delays and missed decisions. Have a Hurricane Plan in Place (Citrus Industry Magazine) adds the staging layer — identify your damage-inspection team and assign tasks before watch-window lockout, not during it. But pre-season planning is only half the answer. The other half is a dashboard that actually ranks the incoming signal stream during the 72 hours when fatigue compounds.
NHC Definition of the Track Forecast Cone explains the irreducible uncertainty: the cone contains the storm center only 60 to 70 percent of the time, which means your workflow must handle the case where the 36-hour warning turns out to be a miss and the storm drifts to a neighboring grove. Dashboards that cannot distinguish actionable track shifts from cosmetic advisory increments burn operator attention at exactly the wrong time.
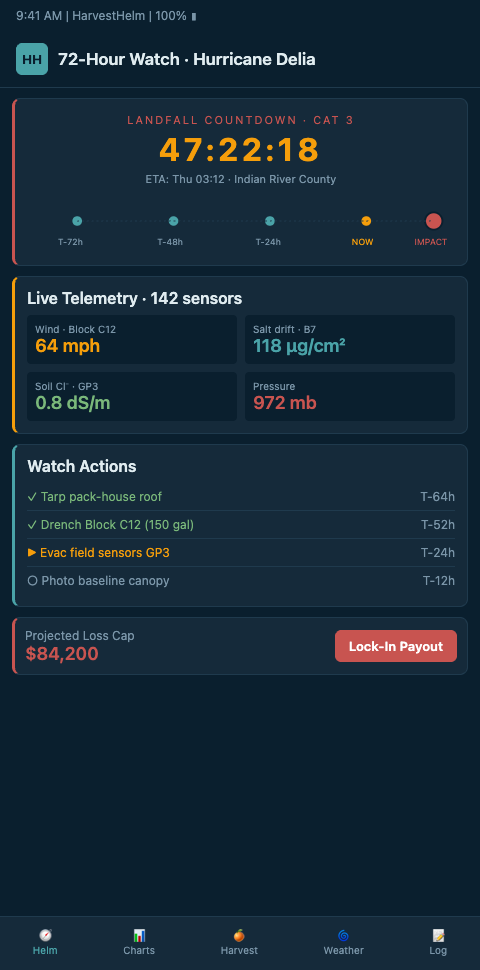
Helm-Charted Incident Mode: T-72, T-48, T-24, T-0, T+24
HarvestHelm's helm-charted yield forecast shifts into incident mode automatically when a grove falls inside the 72-hour forecast cone. The dashboard UI reorganizes around five time horizons, each with its own decision queue, rather than a single unified alert feed. The yacht metaphor: a captain running an inshore passage does not watch every engine gauge equally — she watches the gauges that matter for the next 30 minutes of the passage, then shifts focus as the passage progresses.
At T-72 the dashboard surfaces: track position history, forecast cone geometry, grove block exposure rankings, crew contact status, packhouse reservation confirmation, and fuel-reserve status. Hurricane Preparedness For Citrus Groves (UF/IFAS EDIS CH178) covers the staged 72/48/24-hour checklist for grove managers — HarvestHelm digitizes the checklist into dashboard state with completion checkmarks and timestamps.
At T-48 the dashboard elevates: harvest-pull-forward decisions per block, irrigation-cycle pre-storm scheduling, windbreak inspection status, and real-time advisory delta tracking. The NHC advisory sensors integration pipes advisory changes directly into the incident queue with delta flagging — a 30+ nautical-mile shift in the 48-hour forecast position gets a red badge and a stop-the-show alert; a 5-mile shift gets a logged entry without interruption.
At T-24 the dashboard narrows: final crew dispatch for remaining pull-forward blocks, packhouse loading ETAs, evacuation priority routing, and sensor-network battery verification. Our evacuation priority list workflow drives the dashboard's last 12 hours of grove-side decisions before lockout.
At T-0 the dashboard goes dark on interactive ops and switches to monitor-only mode — grove is evacuated, wind data streams from surviving anemometers, salt-conductivity probes log deposition rates. Precision Agriculture Weather Monitoring (AEM) documents this pattern across enterprise precision-ag deployments: programmable alerts feed operator incident checklists, but during lockout the alerts become forensic data, not action items.
At T+24 the dashboard rebuilds: damage-inspection team routing, sensor-survival audit queue, post-storm irrigation triage, packhouse routing confirmation for pull-forward blocks still in transit. The Aon 2024 Hurricane Response Checklist provides an enterprise-grade 72-hour SOP reference that HarvestHelm maps onto grove-specific assets.
Advanced Tactics: Role-Based Views, Mobile Lockout-Friendly UI, and Decision Logging
The single-dashboard-for-everyone pattern fails during watch windows. A packhouse manager needs to see receiving-dock loading state and crew ETAs; a grove foreman needs to see block-level harvest priority and crew dispatch; a CFO needs to see financial exposure, hedge positions, and insurance claim triggers. HarvestHelm offers role-based dashboard views that share the same underlying state but surface different decision queues per operator.
Mobile lockout-friendly UI matters because the 36 hours before landfall typically involves operators away from desktops — in the field, in trucks, in evacuation staging. The dashboard must work on a phone in 20-knot wind and rain, with large tap targets, offline-capable last-known state, and resumable sync when connectivity returns. HarvestHelm treats mobile reliability as a first-class dashboard requirement, not an afterthought.
Decision logging is the durability layer. Every dashboard action during the 72-hour window should log who, what, when, why. The log supports post-storm insurance claims, USDA disaster filings, and internal retrospectives. Growers who exit a hurricane season with a clean decision log onboard their insurance claims 30 to 45 percent faster than growers reconstructing timelines from memory.
Cross-crop pattern: desert date palm oases face a structurally similar incident window during haboob warnings. Our haboob dashboard workflows post covers the same T-72 through T+24 architecture applied to sandstorm events. The incident-mode pattern generalizes across agricultural hazards — different time-horizons for different hazards, but the principle of ranked queues per horizon holds.
Post-event retrospective is where the workflow compounds. Review each 72-hour window with the team: which alerts fired usefully, which burned attention, which thresholds need tuning. Three seasons of retrospectives turn a generic dashboard into a grove-specific operating manual.
Dashboard Interruption Hygiene
Alert fatigue during a watch window is the silent decision killer. An operator receiving a notification every 8 to 12 minutes across 14 hours stops reading individual alerts and scans for the obvious ones. HarvestHelm applies interruption hygiene: only four alert severities reach the operator's phone — track-shift significant, block-threshold crossed, crew-dispatch action required, and infrastructure-failure flagged. Everything else logs to the dashboard but does not buzz.
The four severities map to four response times. Track-shift alerts expect acknowledgment within 5 minutes during active watch windows. Block-threshold alerts expect acknowledgment within 15 minutes. Crew-dispatch alerts expect action within 30 minutes. Infrastructure-failure alerts expect investigation within 1 hour. The dashboard shows acknowledgment state against the expectation so operators can triage without guessing.
Quiet hours during T-0 lockout are essential. Once the grove is evacuated and the storm is inside the warning window, the dashboard stops pushing actionable alerts because no action is possible. Telemetry logs continue for post-storm reconstruction, but operator sleep is protected. Growers who burn their team through 67-hour windows make worse recovery decisions than growers who preserve 6 to 8 hours of rest during the lockout phase.
Communication Protocols and Team Handoffs
A 72-hour window typically spans three operator shifts. The dashboard must support handoff without state loss. HarvestHelm's shift-handover workflow surfaces the outgoing operator's decision log, any open acknowledgments, and the incoming operator's summary briefing in a single view. Handoffs happen with a verbal confirmation on a ticked checklist, not an email thread.
External communications matter too. Crew supervisors, packhouse partners, juice-plant contracts, insurance contacts, and financial controllers all need updates as conditions change. HarvestHelm supports templated communications that auto-populate with the current helm-charted forecast state so a grove manager can push a situation report to 12 stakeholders in 90 seconds rather than drafting 12 individual messages under time pressure.
Regulatory and safety communications have their own protocols. OSHA rest-period requirements apply during extended work windows, and the dashboard should flag operator hours approaching thresholds that require mandatory rest rotation. Insurance notification requirements for impending claims sometimes specify timing windows — HarvestHelm logs the readiness state so the notification can go out inside the compliance window.
Post-Storm Dashboard Mode and Recovery Sequencing
The dashboard does not exit incident mode at T+24. The recovery window extends T+24 through T+168 with a distinct sequence of priorities: sensor-survival audit, damage-inspection documentation, post-storm rinse prioritization, premium-tier routing adjustment, and insurance notification workflow. HarvestHelm's post-storm phase organizes these priorities into a recovery queue that updates as inspection teams report findings from the field.
Damage mapping becomes the primary workflow input after T+24. Field-team reports, drone imagery, and sensor-network post-event data combine into a block-level damage severity map that drives every subsequent recovery decision. The dashboard surfaces blocks in priority order: highest-damage blocks needing inspection first, then rinse candidates within the 6-to-18-hour window, then irrigation-leaching targets, then routine recovery operations. The single-queue discipline from watch-window operations continues into recovery.
Stop Drowning in Flat Alerts. Run Incident Mode by Time Horizon.
Coastal Valencia, Hamlin, Murcott, and Navel growers working 72-hour hurricane watches cannot survive on flat alert streams that treat every signal as equally urgent. HarvestHelm's incident-mode helm-charted yield forecast sequences decision queues across T-72, T-48, T-24, T-0, and T+24, with role-based views, mobile lockout-friendly UI, and full decision logging. Zero platform fee. The kilo-cut on successful harvest keeps the tool aligned with the decisions that actually preserve fruit through the compressed watch window. Operations joining the pre-season cohort run their T-72-through-T+168 tabletop against an Ian-class track before June, so packhouse reservation confirmations, crew contact state, and fuel-reserve timestamps sit in the dashboard before the first advisory drops. Day one of your dashboard shows the four-tier interruption hygiene — track-shift-significant, block-threshold-crossed, crew-dispatch-required, infrastructure-failure — with quiet hours enforced during T-0 lockout so the Collier County 67-hour fatigue pattern stops costing Murcott boxes.