Forecasting Grove-Level Loss Ratios From 10-Year Hurricane Tracks
When Three Storms Define A Decade
The 10-year hurricane-track window matters specifically because it is the actuarial period that most crop-insurance underwriters and juice-plant contract negotiators default to when pricing forward risk. A longer window smooths out the decadal variability that matters to an individual grower; a shorter window fails to capture enough storms to produce stable statistics. Ten years is the actuarial sweet spot, and HarvestHelm's helm uses exactly that window as the default for grove-level loss-ratio export — with sliders that let the grower rerun the export on 7-year and 15-year alternatives when the negotiation requires a different framing.
A crop broker working Indian River Valencia blocks sat down in January 2025 to renegotiate his juice-plant contract and ran into a wall. The juice plant wanted a 15% haircut on the forward Valencia price because the last 10 years of hurricane track data had priced Indian River into the high-loss-ratio tier. The broker had no counter — he could not produce grove-level loss-ratio evidence for his specific blocks, only a county-wide average dragged down by the three majors. He signed the haircut. The broker lost roughly $840,000 of negotiating leverage because his operations did not have grove-level loss-ratio math rolled up from the 10-year track.
The underlying problem is visible in the headline numbers. USDA ERS documented that Hurricane Milton cut the 2024-25 USDA forecast from 15 million to 12 million boxes, the third major storm in the belt in 10 years after Irma and Ian. But the county average masks wide grove-level variation — some Valencia blocks on the barrier island took 70% loss in Ian, while Hamlin rows 15 miles inland came through with 20% loss. The Atlantic versus Gulf storm pattern differences sharpen the gap further — an Indian River block faces a different 10-year track exposure than a Heartland block, and the regional average blurs both. Without grove-level resolution, every coastal citrus operator is a price-taker against a regional actuarial model built on county-average data that overprices low-exposure blocks and underprices high-exposure ones.
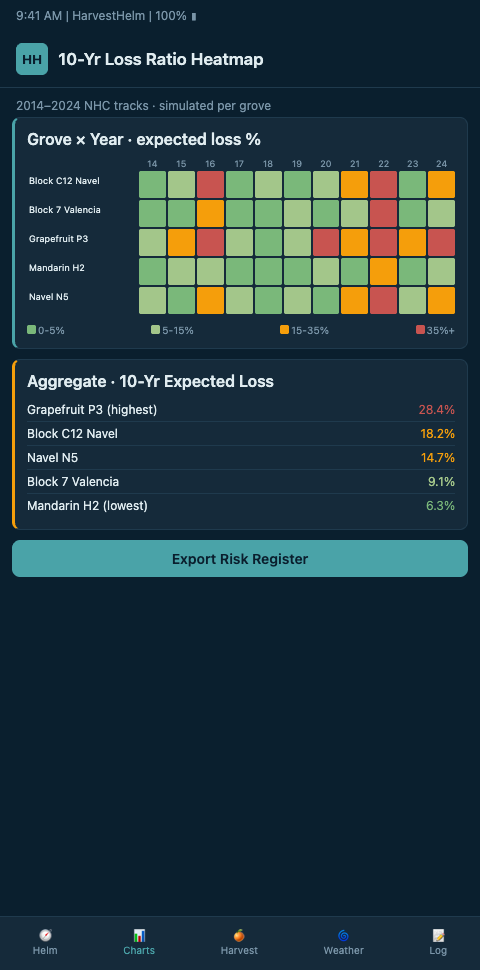
Grove-Level Loss Ratios On The Helm-Charted Yield Forecast
HarvestHelm approaches 10-year loss-ratio forecasting the way a yacht captain reads a chart of past passages: not as a summary of the season, but as a block-by-block record of where salt-spray blackout hit, how hard, and what the Valencia or Murcott response curve looked like. The helm-charted yield forecast stitches together HURDAT2's 1851-2025 best-track dataset, the FEMA National Risk Index hurricane annualized frequency grid, and each grove's own sensor-log history into a loss-ratio surface that shows, for every 40-acre Valencia block, the expected percentage of boxes at risk per year.
The math is straightforward once the data is lined up. HarvestHelm pulls the six-hourly HURDAT2 positions for every cyclone that passed within 50 miles of the grove, maps the modeled salt-aerosol plume for each track using the same plume model the helm runs in real time, and regresses the grove's historical packinghouse throughput against the cumulative exposure. The result is a block-specific loss ratio — not a county average, not a regional number, but a grove-resolution figure the operator can use to renegotiate juice-plant premium tier contracts, crop-insurance coverage, and reinsurance reinstatement pricing. The peer-reviewed correlation between Florida citrus yield and hurricane/freeze event series validates the regression approach at the state level; HarvestHelm applies the same structure at the block level.
HarvestHelm layers industry actuarial practice on top. Verisk's agricultural risk models are the industry-standard probabilistic catastrophe tools reinsurers use for crop-portfolio pricing; HarvestHelm consumes Verisk-compatible outputs and blends them with grove-level telemetry. The RMA Hurricane Insurance Protection Wind Index fact sheet documents HIP-WI coverage for 70+ crops using actuarial-fair-rate methodology via mean loss-cost ratio, and HarvestHelm's loss-ratio output is calibrated against that same methodology so the numbers are directly negotiable with federal and private insurers. The AJAE 2025 treatment-effect approach to hurricane agricultural production risk gave the helm its estimator framework for isolating the hurricane share of the loss ratio versus non-storm factors like HLB disease pressure. The captain at the helm reads one chart and sees the Valencia block's expected annualized loss ratio alongside its historic variance — the numbers he needs to walk into the juice-plant contract conversation with a counter.
Advanced Tactics For Grove-Level Actuarial Negotiation
The first advanced tactic is trajectory variance pricing. A Valencia block that has been hit by three majors in 10 years has a different expected loss profile than one that has been hit by zero — but most juice-plant contracts price them the same because they sit in the same county. HarvestHelm exports block-level loss ratios to the broker's contract negotiation, and the broker presents them against the juice plant's county-average input. The Ferrarezi peer-reviewed correlation work gives the broker an academic citation backing his grove-level discount — the juice plant cannot dismiss it as a vendor pitch. Cross-reference this approach against multi-year chill-hour drift on northeast slopes to see how the same block-level actuarial approach works for apples.
The second tactic is portfolio-level loss-ratio management across a multi-block operation. The portfolio-loss-ratio modeling framework for catastrophic weather impact on crop insurance shows how regional storm cycles drive portfolio-level aggregate loss. HarvestHelm rolls up block-level loss ratios into a portfolio number for the whole grove operation, which lets the grower buy parametric coverage sized to the actual exposure rather than the county-average proxy. A 1,200-acre Valencia operation running three geographically distributed blocks gets a portfolio-smoothed loss ratio that is often lower than the sum of block-level ratios, creating headroom for premium negotiation.
The third tactic is trend-aware pricing. The 10-year track window is not stationary — the Atlantic Multidecadal Oscillation drives 50-70 year cycles in severe hurricane frequency, and operators pricing against a 10-year backward window miss the forward-cycle signal. HarvestHelm overlays the AMO phase onto the grove-level loss ratio so the forecast reflects not only the 10-year history but the expected cycle ahead. Tie this to the basin-specific storm-pattern calibration and to multi-year yield forecasting against hurricane frequency shifts for the decadal forward view. The helm delivers not a point estimate but a range the captain can negotiate against.
Partitioning Storm Damage From Disease Damage
One structural challenge in grove-level loss-ratio modeling is separating hurricane-driven loss from HLB-driven loss, because both have been compounding in Florida citrus over the same 10-year window. A loss-ratio number that lumps them together gives the grower no actionable insight — hurricane losses are insurable via parametric products and traditional coverage, while HLB losses are a cultivar and rootstock management problem. HarvestHelm's helm partitions the two by regressing against the temporal signature: HLB damage shows up as a slow multi-season yield decline, while hurricane damage shows up as discrete event-driven drops. The partitioned loss ratios flow into different decision paths: the hurricane component goes to the broker for insurance negotiation, and the disease component goes to the agronomist for cultivar-management planning.
The partition math also matters for replant valuation. A Valencia block showing a 40% cumulative 10-year loss might be 25% hurricane-driven and 15% HLB-driven, which supports a replant decision focused on HLB-tolerant rootstock rather than coastal-retreat resignation. Without the partition, the grower might assume the whole 40% is hurricane exposure and conclude the block is no longer economically viable, when in fact an HLB-tolerant rootstock combined with parametric hurricane coverage would restore the block's expected profitability. HarvestHelm's partitioned loss-ratio output is the evidence that supports these nuanced replant decisions.
Reconciling Loss Ratios With Reinsurance Tier Definitions
Reinsurers classify coastal citrus into tier bands that drive the cedant's per-acre pricing. A Valencia block in a Tier 1 band — high-frequency, high-severity — prices at substantially higher per-acre rates than the same block in a Tier 3 band. HarvestHelm's block-level loss ratio, rolled forward with AMO adjustment, slots directly into the reinsurer's tier classification workflow so the grower can contest a Tier 1 assignment when the block-level data supports Tier 2. Most groves never attempt this contest because they lack grove-resolution evidence; the HarvestHelm export reverses that dynamic. Brokers walking into tier renegotiation with a block-level annualized loss ratio, AMO-adjusted forward, and multi-source telemetry log have a defensible counter against the standard tier assignment.
The reinsurance-tier logic also matters when the grower is negotiating bundled insurance with juice-plant forward contracts. A juice plant that holds a haircut on the grower's forward price is implicitly charging a risk premium; the HarvestHelm loss ratio export lets the grower either dispute the haircut or accept it while unbundling the risk component onto a parametric policy. The broker who combines HarvestHelm's block-level loss ratio with a parametric salt-sensor trigger and a traditional HIP-WI policy often lands a composite coverage structure that costs less than the juice-plant haircut would have cost in forfeited revenue. This is the financial-engineering frontier for coastal citrus growers who have been accepting the haircut as the price of doing business with the juice plant.
The tier-reconciliation workflow also feeds into the parametric-layer pricing. A grove priced in Tier 1 under the regional model but at Tier 2 under HarvestHelm's block-level export can still buy parametric coverage at the Tier 1 trigger rate and pocket the difference. Because the parametric pricing rides on the trigger's statistical distribution rather than the reinsurer's tier assignment, the grower captures the arbitrage between the two pricing systems.
Coastal citrus growers who walk into juice-plant contract season with only county-average loss data are bringing a spreadsheet to a helm fight. HarvestHelm's 10-year grove-level loss-ratio exports give Valencia, Hamlin, and Murcott operators the block-specific evidence they need to contest the regional actuarial haircut — and because HarvestHelm runs on the kilo-cut revenue model, growers pay nothing for the loss-ratio modeling itself. The broker in our opening story would have kept $840,000 of negotiating leverage had he walked in with a HarvestHelm block-level export. The next contract cycle, every coastal operator faces the same ask. The ones carrying grove-resolution loss ratios will be the ones holding price.