Predicting Multi-Year Grove Yield From Hurricane Frequency Shifts
The 20-Year Production Curve That Tells The Story
The replant decision is the single largest CapEx question a multi-generation citrus operator faces, and it sits at the intersection of agronomy, insurance, financing, and climate forecasting. Getting the decision wrong in either direction is expensive: replanting Valencia on acreage that will be chronically storm-exposed sinks $4 million into a declining asset, while walking away from replant on acreage that will actually perform well forfeits decades of future revenue. The grower needs a projection that is both storm-aware and cultivar-aware, because the right answer often involves swapping cultivar or rootstock rather than abandoning the acreage entirely.
A third-generation Valencia grower sat down with his consulting agronomist in March 2026 to decide whether to replant 180 acres of barrier-island block that Ian and Milton had damaged. The replant cost would run roughly $4.2 million over three years before the new Valencia rows would produce fresh-market fruit. The agronomist pulled up USDA NASS Florida citrus production forecasts and walked the grower through the multi-year decline — the 2024-25 Florida orange forecast at roughly 12 million boxes, against the 1997-98 peak of 244 million. Citrus Industry Magazine documented the 92% decline as a multi-hurricane cumulative effect compounded by HLB disease pressure. The grower needed a multi-year yield projection that separated the storm component from the disease component and projected forward against hurricane-frequency trends.
That forecast is not a linear extrapolation. IPCC AR6 on tropical cyclones assigns medium confidence to the projection that Cat 4-5 storm proportion will rise, with average intensity increasing 1-10% per 2°C warming. NOAA GFDL projections on global warming and hurricanes show decreasing storm counts but increasing intense-hurricane frequency and 10-15% more rainfall. Those two signals — fewer but more intense storms, with more rainfall per storm — change the multi-year yield math. A replant decision made on the stationary-climatology assumption would be wrong; a replant decision made on the hurricane-frequency-shift-aware projection would be much closer to right.
The Helm-Charted Yield Forecast On A Multi-Year Horizon
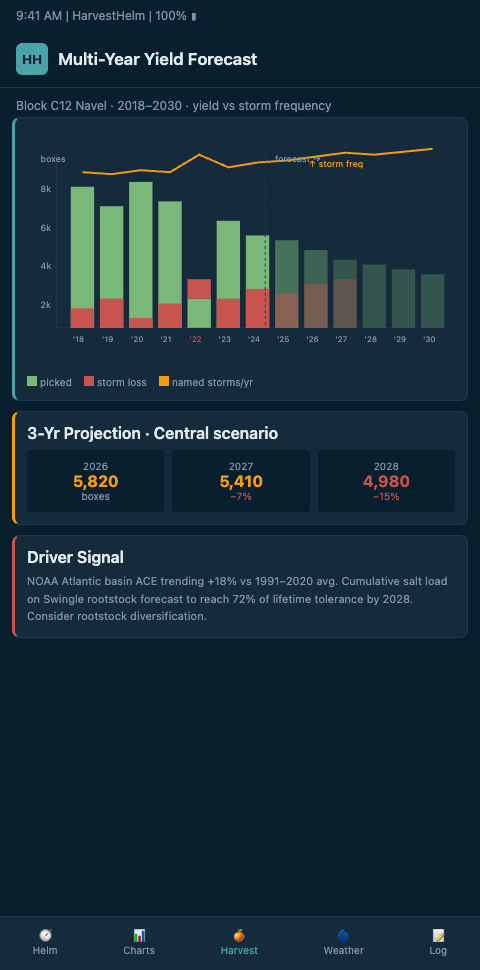
HarvestHelm extends the helm-charted yield forecast beyond the current harvest season into a multi-year projection that treats the grove as a 15-year asset rather than a one-season cash flow. The helm pulls the Yale Climate Connections analysis of climate change and U.S. major hurricane landfalls as one input to the forward-frequency model, then overlays the Ferrarezi peer-reviewed correlation between Florida citrus yield and hurricane/freeze event series as the empirical Florida-citrus calibration. The output is a block-level yield projection across the next 10 years that tells the grower what Valencia, Hamlin, or Murcott blocks will likely produce under the projected storm regime.
The projection math separates storm damage from disease damage. UF/IFAS's estimating-citrus-production-loss-due-to-HLB baseline tool provides the analytical structure for partitioning multi-year yield loss between disease and storm drivers, and HarvestHelm uses it to isolate the hurricane-frequency signal in the forward projection. The hurricane-partitioned component feeds directly into the 10-year loss ratio forecasting export so the replant math and the actuarial negotiation share one block-level baseline. The IntechOpen review on climate change and citrus documents how temperature, water stress, and storm damage reduce fruit set, June drop, and yield over multi-year horizons — HarvestHelm incorporates the review's damage-pathway framework into the forward model so the projection captures not only direct hurricane fruit-drop but the multi-year stress-compounding that shows up in subsequent seasons.
The captain at the helm sees three projection scenarios on one chart. Low-frequency scenario: one major in the next 10 years, yielding a Valencia block projection near 80% of the historical 10-year average. Mid-frequency scenario: three majors in the next 10 years, yielding roughly 55%. High-frequency scenario: five majors in the next 10 years, yielding roughly 30%. The grower reads the three scenarios against the replant CapEx and computes the break-even frequency — the hurricane count at which replanting Valencia is a losing decision versus converting to a less storm-vulnerable cultivar or rootstock. That calculation, grounded in the helm's projection, is the backbone of a defensible replant decision. HarvestHelm's kilo-cut revenue model means the projection itself costs nothing — the multi-year forecast is part of the helm's standard output on any grove the platform charts.
Advanced Tactics For Multi-Year Planning
The first advanced tactic is cultivar-swap modeling. The helm runs parallel multi-year projections for Valencia versus Hamlin versus Murcott on the same block geography, so the grower can see which cultivar's forward yield curve best matches the projected storm frequency. Valencia's later-season maturity means a higher exposure to peak-hurricane months, while Hamlin's earlier-season pull typically clears the packinghouse before the September-October peak — a cultivar-swap decision that the helm quantifies in expected dollars per block per decade. The cultivar-swap math stacks directly with the actuarial-negotiation baseline so the replant decision is priced against the same per-block loss ratio the broker is using at renewal.
The second tactic is rootstock-selection integration. The helm incorporates rootstock salt-tolerance data from UF CREC into the multi-year projection so the grower selecting a replant rootstock sees the expected yield difference between a tolerant and a sensitive rootstock under the projected storm regime. A salt-tolerant rootstock that costs $1.80 more per tree may return $4,200 per acre over 10 years under the mid-frequency scenario — a straightforward economic return the helm surfaces on the projection chart. Connect this rootstock tactic to climate-risk pricing for coastal citrus to see how the multi-year operational decisions feed into the broader financial repricing of coastal groves.
The third tactic is cross-niche decadal validation. HarvestHelm runs the same multi-year projection structure on night-low harvest windows, where the threat vector is diurnal-swing-driven fruit damage rather than hurricane exposure. The cross-niche comparison stress-tests the multi-year projection methodology against fundamentally different climatological signals, which sharpens the Florida citrus projection when it is calibrated against the same statistical framework. The kilo-cut revenue model means the grower pays nothing for the cross-niche validation work, and only pays on the harvest-save benefit the projection actually delivers.
Rainfall-Intensity Interaction With Yield Projection
GFDL's projection of 10-15% more rainfall per storm adds a second-order effect to the multi-year yield projection that pure frequency-count models miss. More rainfall per storm drives more freshwater flush of the soil profile after the salt-aerosol deposition event, which in some cases actually reduces the long-term salt damage compared to a low-rainfall storm that leaves the salt sitting in the root zone. But in other cases, the increased rainfall drives fruit split and fungal pressure that offsets the flush benefit. HarvestHelm's helm runs a rainfall-intensity sensitivity alongside the frequency sensitivity so the grower can see which blocks benefit from the higher-rainfall projection and which blocks suffer under it.
The answer depends on block geography and drainage infrastructure. A Valencia block with efficient drainage and sandy soil benefits from post-storm rainfall because the flush moves salt out of the root zone quickly without waterlogging the trees. A block with heavy clay soil or inadequate drainage suffers from the rainfall because the water sits, the fruit splits, and fungal pressure climbs. HarvestHelm layers this block-by-block drainage classification into the multi-year projection so the grower's replant decisions can favor blocks with good drainage for future Valencia and divert poor-drainage blocks toward Hamlin or Murcott where the fruit-split risk is lower.
Sensitivity Analysis And Scenario Weighting
Any multi-year projection that does not expose its sensitivity assumptions is a black box that growers should distrust. HarvestHelm's helm surfaces the three key sensitivity parameters — storm frequency, per-storm severity, and HLB-disease progression — with adjustable sliders that let the operations manager test the projection under different scenario weights. If the grower believes the AMO warm phase will extend longer than the consensus forecast, he can push the frequency slider higher and see the projection's block-level output shift accordingly. If he believes rootstock resistance to HLB is improving faster than UF/IFAS projections, he can push the disease slider lower and watch the projection recover. The sliders are not just a UI convenience — they force the grower to articulate his assumptions explicitly, which sharpens the replant decision by grounding it in stated beliefs rather than implicit defaults.
The scenario-weighting structure also supports cooperative planning across multi-grower groups. A cooperative of Valencia growers along the Indian River might disagree on the AMO forward forecast, but they can run the helm's projections under each member's preferred scenario and then weight the composite cooperative replant plan by each member's conviction. That process turns a potential disagreement into a quantified portfolio of bets, and the cooperative can size its replant capital allocation to match the weighted scenario distribution. HarvestHelm's kilo-cut revenue model accommodates this cooperative planning because the helm costs nothing to run — the scenario modeling is free, and only the harvest revenue carries the fee.
Coastal citrus growers making replant decisions without multi-year frequency-shift-aware yield projections are effectively flipping a coin on $4 million of CapEx. HarvestHelm's helm-charted yield forecast extends the daily hurricane-hour early warning beacon into a 10-year projection that separates storm damage from disease damage and projects forward against IPCC and GFDL guidance. Valencia, Hamlin, and Murcott growers facing replant questions on Ian-damaged or Milton-damaged acreage should demand block-level multi-year projections from their agronomy stack.
Book a replant-decision session with HarvestHelm before your next CapEx board meeting — we install sensors across the candidate blocks, load your prior storm and HLB history into the helm, and deliver the 10-year block-by-block economics under your AMO and disease-progression scenarios. The grower in the opening story made his replant call with HarvestHelm's projection in March 2026 — and kept the CapEx on barrier-island acreage where the math supported it, while converting the higher-risk blocks to a salt-tolerant rootstock. That decision would have been unsupportable without a helm to chart it.