6 Salt Ingress Signals Your Grove Shows Before Leaf Drop
Salt Ingress Is a Tip-Down, Tip-First Progression
Citrus leaves accumulate chloride to a toxic threshold before they drop, and the literature is specific about the number. UF/IFAS EDIS SS619 documents leaf injury appearing at 0.3% chloride on a dry-weight basis, with burn progressing from leaf tips down before abscission (UF/IFAS EDIS SS619: Boron and Chlorine for Citrus). A chloride-absorption study comparing Carrizo and Cleopatra rootstocks confirmed that leaf Cl accumulation precedes visible burn and drop, and tracks water use rates (Oxford JXB: Chloride Absorption Carrizo vs Cleopatra).
A ScienceDirect review on citrus salt physiology confirmed that chloride toxicity with necrotic leaf edges is the single most common visible salt-injury symptom (ScienceDirect: Salt stress physiological citrus low Cl- accumulation). The practical implication for coastal Florida growers: once you see tip burn, you are already inside the accumulation window, and the correct response is not wait-and-see — it's flush and forecast. The grove that confuses tip burn with boron deficiency or with cold damage is the grove that treats the wrong problem and loses the fruit before the correct diagnosis lands.
The economic pressure behind early reading: Valencia and Hamlin blocks missing the juice-plant premium tier because of brix drop can lose 20-30% per pound of revenue. Murcott blocks slipping from 80-count to 125-count cartons give up the premium-tier export pricing. Brokers and packinghouse contracts write around size and brix specifications, and salt-stress events hit both. Growers who catch the stress at signal 1 or 2 can intervene and preserve the spec band; growers who catch it at signal 5 or 6 are negotiating a downgrade. The revenue difference between catching the stress at signal 1 versus signal 5 can easily exceed a full season's investment in monitoring infrastructure — which is why coastal growers who have run the six-signal chart for multiple seasons rarely return to the older visual-inspection-only approach.
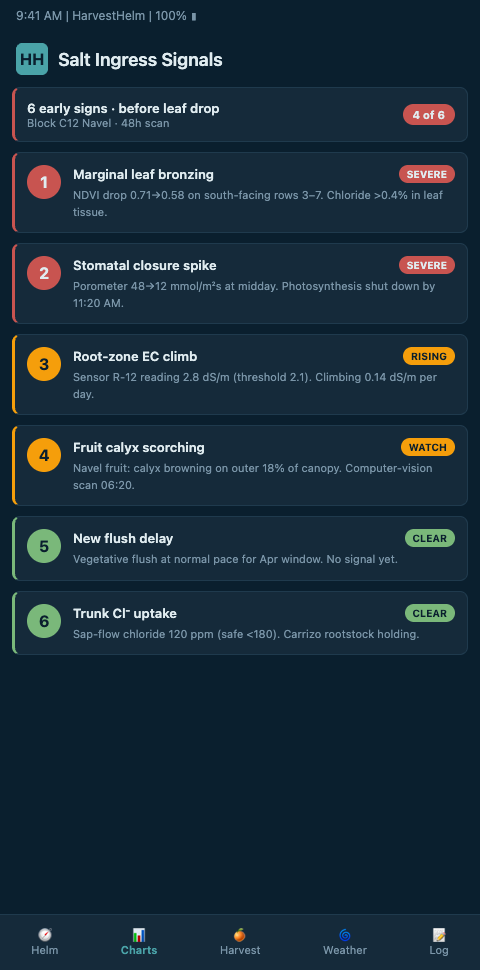
Six Signals You Can Read Off the Helm-Charted Yield Forecast
HarvestHelm ingests sensor and leaf-symptom data and surfaces six leading signals on the yacht navigation dashboard, charted as keel-level indicators the captain can read in one pass. The chain begins with the upstream salt deposition patterns arriving at the canopy, and from there the helm-charted yield forecast plots the downstream six-signal progression as rising bars per block, with color coding that escalates from caution to hurricane-hour alert as chloride accumulates.
- Rising soil EC. Coastal citrus yield reduction begins at 1.8 dS/m, with 16% loss per additional dS/m above threshold (Citrus Industry: Citrus and Salinity). HarvestHelm flags sustained EC climb before leaves turn.
- Canopy EC differential. First-line rows cross threshold first; interior rows lag. A widening differential is an aerosol ingress signal.
- Leaf chloride accumulation curve. Sensor-inferred leaf Cl% climbing toward 0.3% — the action threshold from SS619.
- Tip-browning onset. Visual symptom captured in crew walkthroughs; CH142's visual symptom guide remains the reference field-chart (UF/IFAS EDIS CH142: Citrus Nutritional Deficiency and Toxicity ID).
- Marginal necrosis pattern. Chloride-driven necrotic margins are distinct from boron or cold burn and need separate handling.
- Premature abscission uptick. Leaf drop rate per tree per week climbing above baseline — terminal signal.
The HarvestHelm chart treats the six signals as a dependent sequence. Signal 1 leads signal 2, which leads signal 3, and so on. A block showing signal 4 without signals 1 and 2 is almost certainly registering a different stress — drought, nutrient imbalance, or cold injury — not salt. The captain reads the signal sequence like a heel-angle and sail-trim progression, and the dashboard flags out-of-order symptoms for ground-truth review.
The intervention tree is tight. UF/IFAS EDIS AE217 documents how to monitor irrigation TDS and EC and flush the root zone before chloride climbs to burn levels (UF/IFAS EDIS AE217: Managing Irrigation High Salinity Water). SS678 covers irrigation timing, fertilizer salt-index selection, and frequency adjustments (UF/IFAS EDIS SS678: Nutrition of Florida Citrus — Special Situations). HarvestHelm sits on top of both references, showing which intervention is indicated by which signal.
A typical daily helm-chart read, on a grove running eight blocks: two first-line Hamlin blocks showing signal 1 (EC climbing), one mid-grove Valencia block showing signal 2 (canopy differential widening), five interior blocks clear. The captain's action list is correspondingly tight — flush the two first-line blocks, monitor the Valencia block and walk it by midday, hold the interior five. The chart gives three distinct interventions for an eight-block grove instead of a blanket grove-wide action. That precision is what makes the signal-sequence model operationally useful.
Sensor placement shapes signal quality. A grove running sensors only at root-zone depth (30 cm) will catch signal 1 (EC climb) reliably but miss the earlier canopy-level signals. A grove running sensors only at canopy tops will catch aerosol arrival but miss root-zone ingress. HarvestHelm's recommended configuration runs three sensor layers per block — canopy top, mid-canopy leaf-level, and root-zone — so the signal sequence reads across physiological compartments rather than only one. For groves transitioning from a single-layer monitoring setup, the first season with the three-layer configuration typically reveals signal patterns that explain historical brix drops the grove had previously attributed to unknown causes.
Sensor survivability through storm events is a distinct concern. Sensors mounted in tree canopies take wind and debris exposure during hurricane-force events, and a sensor network that returns to service with 90% of nodes intact behaves very differently than one returning at 60%. HarvestHelm's hardware recommendations prioritize protected placement and rapid replacement logistics so the network restores full coverage inside 48 hours of storm passage. Growers who treat sensor survivability as a design priority rather than an afterthought end up with continuous salt-risk monitoring through the most economically consequential weeks of the year — the weeks immediately after a storm when salt loads are highest and the grove is recovering.
Advanced Tactics: Reading Signals Against Rootstock and Upstream Events
Different rootstock handles chloride differently, so the same soil EC reading produces different leaf-level consequences. A Cleopatra-rooted Murcott can tolerate EC bands that a Carrizo-rooted Valencia cannot. Reading the signal chart alongside the aerosol-deposition layer lets the captain see which signal is driven by canopy deposition versus brine-water uptake at the root zone — a split that matters because the canopy and root-zone interventions are different.
The second tactic is moving from reactive flush to predictive mitigation. Once the helm chart shows a reliable EC climb ahead of leaf symptoms, you can pre-position flush water before the advisory cycle triggers. This is the shift from reactive brine mitigation to predictive brine mitigation, and it materially changes your post-storm brix outcome.
Cross-niche pattern recognition helps. Tropical mango plantations use a comparable leading-indicator chain for anthracnose pressure signals — different stressor, same "read the sensor signal before the symptom lands" discipline. Common field mistakes:
- Treating tip burn as evidence of nutritional deficiency and adjusting fertilizer.
- Missing signal 1 (EC climb) because sensors are sampling at wrong depth.
- Flushing with marginally saline water and layering in more chloride.
- Ignoring rootstock-dependent tolerance bands and running a grove-wide threshold.
- Sampling at a single time of day — diurnal EC variation masks the trend.
- Skipping the canopy-top/lower-interior vertical gradient and missing the actual salt-ingress physiology.
Multi-season pattern recognition is the next tactical layer. A block showing the same seasonal signal pattern year after year is telling you something about geometry and drainage that static analysis missed. HarvestHelm tracks the seasonal signature per block and flags repeating patterns — a block that always shows signal 1 in late September deserves a preemptive flush schedule built around the recurring pattern, not a reactive response after the signal lands.
The early-warning chart also supports crop-broker and packinghouse conversations. A grove that can show six-signal monitoring with intervention-timestamped records gives downstream buyers visibility into the salt-risk management program rather than asking them to trust an unmonitored operation. Over several seasons, growers with HarvestHelm deployments report that their brokers price their fruit against a known-quality baseline — which stabilizes the grower-side revenue against weather volatility. The signal chart functions as a trust document between grove and buyer, not only as an agronomic instrument.
The six-signal framework also maps cleanly onto insurance and disaster-relief documentation requirements. When a grove files a claim for salt-driven yield loss, the ability to show timestamped signal progression, intervention records, and post-event block-level damage creates a defensible claim narrative. The helm chart's history export is structured to meet FDACS and FSA documentation requirements without additional paperwork — the monitoring record is already the claim record. Growers who have used this pathway report substantially faster payout timing and more accurate payout amounts compared to operations that reconstruct the event history after the fact. In a risk environment where federal relief can lag the event by 12-18 months, compressing the documentation timeline materially changes grove cash flow.
Get Early Access to the Coastal Citrus Grove Dashboard
Coastal Florida Valencia, Hamlin, and Murcott growers who want the six-signal chart running before next Atlantic season should join the Coastal Citrus Grove waitlist. HarvestHelm calibrates the signal sequence to your rootstock-cultivar mix and your existing EC sampling routine, so the helm chart reflects your grove — not a generic coastal blob. Send us your current EC reading cadence and your last brix-drop event timeline and we'll set up your baseline. Operations onboarding before the May cohort get their canopy-top, mid-canopy, and root-zone sensor layers deployed and calibrated before the first onshore squall of the depression season, with leaf Cl accumulation curves tracked against the 0.3% dry-weight action threshold from SS619.
Day one of your dashboard shows the six-signal ladder per block — EC climb, canopy EC differential, leaf chloride curve, tip-browning onset, marginal necrosis, and abscission uptick — with out-of-sequence symptoms flagged for ground-truth review. Groves with Carrizo-under-Valencia and Cleopatra-under-Murcott blocks see distinct tolerance bands per block rather than a grove-wide threshold, so the three-distinct-interventions-per-eight-blocks precision lands the first week of monitoring. Growers sharing their last brix-drop timeline and sampling-depth configuration get their historical unexplained drops re-attributed to specific signals as the sensor network collects its first 90 days of baseline data, turning past mysteries into calibration inputs for the kilo-cut contract.