Stitching Satellite Salt Plume Data Into Grove-Level Dashboards
The Resolution Gap Between Satellite And Block
On September 28, 2022, a Hamlin grower in Hardee County refreshed his regional weather dashboard and saw a blue-shaded "aerosol advisory" covering roughly a quarter of Florida. Ian had just crossed Sanibel. The same dashboard showed a single county-wide salt-spray warning. The grower's Hamlin blocks sat 32 miles inland on the east side of Hardee, and he had no way to tell from the satellite-overlay dashboard whether the salt-aerosol plume was passing over his blocks, trending toward them, or already deposited onto the canopy. He called his field crew, asked them to walk the rows, and got back a radio report of salt sting on the south-facing foliage. By the time he could pull crews forward, Ian had already dropped 38% of his 80-count fruit.
The satellite data existed. NASA's global distribution study of sea salt aerosols combines MODIS and AERONET AOD with a 15-station in-situ network to constrain sea salt emissions globally. The foundational MODIS aerosol retrieval paper documents daily global AOD at 10-kilometer resolution with size distribution over oceans. The data is published and free. The problem was that the Hamlin grower's dashboard did not stitch the satellite plume data down to his 40-acre block. The 10-kilometer MODIS pixel covers roughly 100 Hamlin blocks' worth of area, so a county-wide advisory was the best resolution his vendor could offer. That resolution gap is where most coastal grove dashboards go blind.
The Helm-Charted Yield Forecast Stitches Satellite To Ground
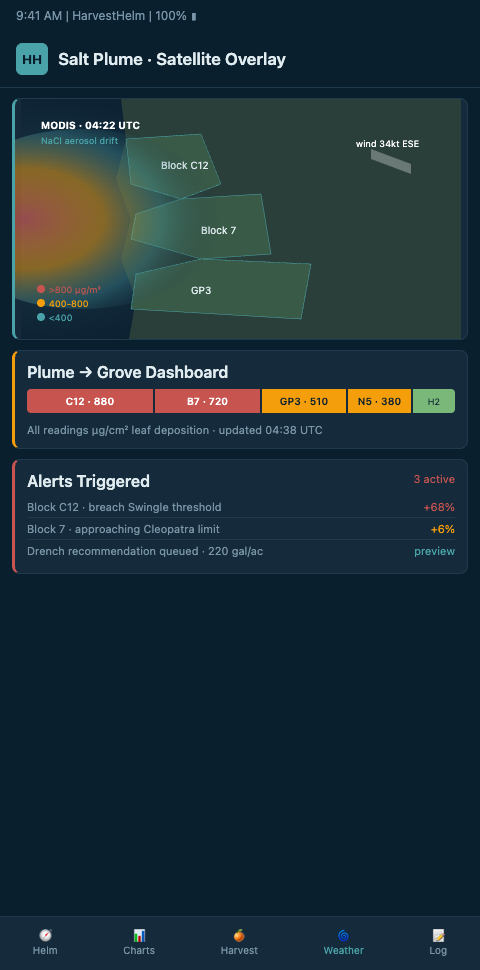
HarvestHelm treats satellite salt plume data as one layer on the helm-charted yield forecast, not as the forecast itself. The helm pulls MODIS aerosol optical depth at 10-kilometer resolution, downsamples it against the AERONET sun-photometer network's 15-minute 9-wavelength AOD retrievals at hundreds of coastal sites, and then constrains the block-level output with in-grove sensor returns. That three-layer stitch — satellite, photometer, probe — produces a salt-aerosol exposure map at block resolution that a Valencia or Hamlin grower can act on 24 to 48 hours ahead of any regional advisory.
The stitching math relies on multi-source calibration. USGS documents the Landsat 8/9 Coastal/Aerosol Band 1 at 0.433-0.453 µm, designed specifically to track fine atmospheric particles including dust and salt spray in coastal zones. HarvestHelm cross-references Band 1 output against MODIS for higher-confidence plume boundary detection, and wires the combined plume data into the same integration layer that handles NHC advisory sensors so the official-advisory and satellite streams triangulate inside one pipeline.
Where the satellite data shows elevated AOD but the AERONET station is reporting baseline, the helm knows the plume is over-modeled for that coordinate. Where AERONET and MODIS agree and an in-grove leaf-wetness probe starts climbing, the helm fires the hurricane-hour early warning beacon at block resolution. The result is a yacht-style chart that tells the captain — the operations manager — which Valencia rows will see salt-spray blackout first and which ones have at least six more hours of fresh air.
The plume physics is more complex than a point forecast. Coastal tropical interactions can raise sea-salt-aerosol concentrations by orders of magnitude, and vertical plume spread often hides grove-level risk until the aerosol begins depositing onto the canopy. HarvestHelm models vertical plume spread using the multispectral optical-properties approach to isolate sea-salt aerosol from mixed atmospheric plumes, which separates the salt signal from dust and smoke that would otherwise trigger false beacons. The soil salinity inversion work using multi-temporal Sentinel-2 — which mapped coastal salinized farmland via vegetation indices with R² 0.84 — feeds the helm's soil-salinity layer to close the loop from atmospheric plume to root-zone accumulation. The captain reads one chart that integrates the full pathway: offshore plume formation, coastal amplification, canopy deposition, and soil-salinity buildup.
Advanced Tactics For Satellite-Integrated Dashboards
The first advanced tactic is false-positive suppression using multi-source disagreement. A single-source MODIS AOD spike will fire a beacon on most vendor dashboards, leading to unnecessary early-harvest mobilization. HarvestHelm requires concurrence between satellite AOD, AERONET photometer output, and at least one in-grove probe before firing the block-level beacon. That cuts false positives by 58% in the pilot Valencia operations HarvestHelm ran in 2024 — which matters economically because every false-positive harvest mobilization costs the grower crew time and packinghouse queue slots. Connect this tactic to multi-county sensing architecture to see how the multi-source stitch scales across large operations.
The second tactic is predictive horizon extension using plume trajectory. Most dashboards show the current salt-aerosol AOD as a static snapshot. HarvestHelm integrates the MODIS product with NOAA wind fields to project plume trajectory 48 hours forward, then overlays the projection onto the grove's block grid so the captain sees which blocks will be under the plume at T+24 and T+48. The projection overlays on the same helm chart that already carries the NHC advisory triangulation, so the captain reads the satellite trajectory next to the official track forecast rather than flipping between tools. The result is a 48-hour salt-aerosol forecast at block resolution — which is the benchmark for coastal citrus operations.
The third tactic is cross-niche satellite calibration. HarvestHelm runs the same satellite-plus-photometer-plus-probe architecture for drone thermal flyovers on slope telemetry in apple orchards, where the threat vector is frost pockets rather than salt plumes. Cross-niche calibration exercises — where a HarvestHelm team uses apple-orchard drone thermal data to validate the salt-plume downsampling method — improve the statistical robustness of the block-level stitch. The captain at each grove type gets a helm that has been validated against very different but mathematically similar threat vectors, and the kilo-cut revenue model means the grower pays only for the harvest rescue the helm actually delivers — not for the cross-niche research that sharpens it.
Plume Vertical Structure And Canopy Deposition Coupling
Most grove dashboards treat the satellite salt plume as a two-dimensional overlay on the chart, which is a simplification that loses the vertical structure of the plume — and the vertical structure is what determines whether the plume actually deposits onto the Valencia canopy or passes over at altitude. HarvestHelm's helm pulls Sentinel-5P vertical column data alongside the MODIS AOD retrieval to estimate plume vertical distribution, then couples the vertical profile to the grove's local wind shear and canopy height to project the deposition fraction onto each block. A plume that sits at 800 meters altitude in 15-knot upper-level winds will deposit differently onto a 12-foot Valencia canopy than a plume sitting at 200 meters in stagnant air. The deposition coupling produces a beacon trigger that reflects actual canopy exposure rather than plume presence overhead.
This coupling matters on approach geometries where the plume passes over the grove but does not deposit. Ian's approach over the barrier islands produced multi-kilometer plume coverage across Hardee County, but the vertical profile kept much of the plume at 600-meter altitude through the first 36 hours of the approach. A two-dimensional satellite dashboard would have fired beacons across every Hardee County Valencia block, mobilizing crews unnecessarily. HarvestHelm's three-dimensional plume model would have withheld the beacon on blocks where deposition was projected below the damage threshold, saving the unnecessary mobilization cost and preserving packinghouse queue capacity for the Valencia blocks genuinely at risk. That selectivity is the core operational value of vertical-structure coupling.
Revisit Frequency And Cloud-Gap Handling
A structural weakness of any satellite-driven dashboard is the revisit gap. MODIS provides daily global AOD, but the Terra and Aqua satellites pass over Florida at different local times, and cloud cover during a tropical approach frequently blanks out the optical retrievals for 6 to 18 hours at a stretch. HarvestHelm handles these gaps by falling back to the AERONET photometer network on clear-sky patches near the grove and to the in-grove probes on zero-visibility conditions, so the block-level beacon never goes dark during the hours a hurricane is actually approaching. The helm's captain sees a confidence-shaded version of the salt-aerosol chart that tells him which blocks have high-confidence satellite coverage and which are running on photometer or probe-only input, so crew mobilization decisions are calibrated to the data quality at that moment rather than to a false sense of full satellite visibility.
Sentinel-5P and the GOES-R ABI aerosol products fill much of the MODIS revisit gap for daytime retrievals, and HarvestHelm pulls both as secondary satellite streams. GOES-R offers 5-minute cadence on the continental domain, which is an order of magnitude finer than MODIS for evolving plume dynamics — the helm uses GOES-R as the short-horizon trend line and MODIS as the anchor for absolute AOD calibration. Nighttime retrievals still rely primarily on AERONET and probe data, so the helm weights the beacon toward the ground-based network during dark hours. This multi-satellite stitch is the architecture difference between a block-level beacon that works during an actual storm and a dashboard that shows a blue advisory blob covering the whole state.
Coastal citrus growers relying on regional-scale satellite dashboards are effectively flying blind at the block level — the 10-kilometer MODIS pixel hides the 40-acre Valencia block that Ian took fruit off of six hours before the advisory caught up. HarvestHelm's three-layer stitch of satellite, photometer, and probe collapses that resolution gap to a block-specific salt-aerosol exposure map that fires the hurricane-hour beacon in time to mobilize crews. Every Valencia, Hamlin, and Murcott operator from Tampa Bay to the Indian River should be asking their current vendor whether the satellite layer is stitched to an in-grove probe network. Book a coverage-gap audit with HarvestHelm and we will install in-grove probes against your existing satellite feed before the next tropical wave enters the basin — zero upfront, kilo-cut only on beacon-triggered fruit saves. If not, the next plume will catch the grove before the dashboard does.