Mapping Storm Surge Exposure Zones Across Navel Orange Blocks
Why Navel Orange Blocks Need Block-Level Surge Mapping
After Hurricane Ian, growers reporting to UF/IFAS documented that citrus root zones held saturated for three days or longer at high temperatures suffered severe and often irreversible damage (Citrus Industry: What To Do When Groves Flood). Navel orange blocks sit at extra risk because their cultivar-rootstock pairings are often on heavier, lower-lying soil — exactly the soils UF/IFAS identifies as most vulnerable to post-surge Phytophthora foot and root rot (UF/IFAS EDIS CG009: Phytophthora Foot/Root Rot).
The baseline problem is granularity. Traditional planning used county-level or property-level flood overlays. Surge hits a grove at bathtub-ring precision — a dozen feet of elevation can separate a rescued block from a total loss. UF/IFAS EDIS AE572 documents how saltwater intrusion and storm surge flooding jointly reduce soil health and productivity across coastal Florida agriculture (UF/IFAS EDIS AE572: Saltwater Intrusion and Flooding Risks). And sea level rise on a decade horizon is reshaping the baseline — the Miami-Dade SLR agricultural community report quantifies how today's marginal blocks become tomorrow's catastrophic losses (Miami-Dade SLR Agricultural Community Report).
The economic stakes line up with the agronomic ones. When a navel orange block collapses post-surge, the loss extends beyond the current season's fruit. Tree replacement runs to tens of thousands per acre, and the grove surrenders four to five seasons of production before a replanted block reaches the yield curve. Federal disaster relief historically lands 12-18 months after the event — often two growing cycles too late to bridge cash flow. The block-level surge map is not merely a planning tool; it's the input to the capital allocation question of which blocks to protect, which to let go, and which to replant preemptively with more surge-tolerant rootstock combinations.
Layering SLOSH Surge Maps Into a Helm-Charted Yield Forecast
The 2025 reprocessed SLOSH grid covering the U.S. Gulf and East Coast brought surge resolution down to levels that make grove-scale planning viable (NHC National Storm Surge Risk Maps V4). The complementary potential storm surge flooding map merges real-time inundation on a 625 m NDFD grid — parcel-scale input for operational decisions (NHC Potential Storm Surge Flooding Map).
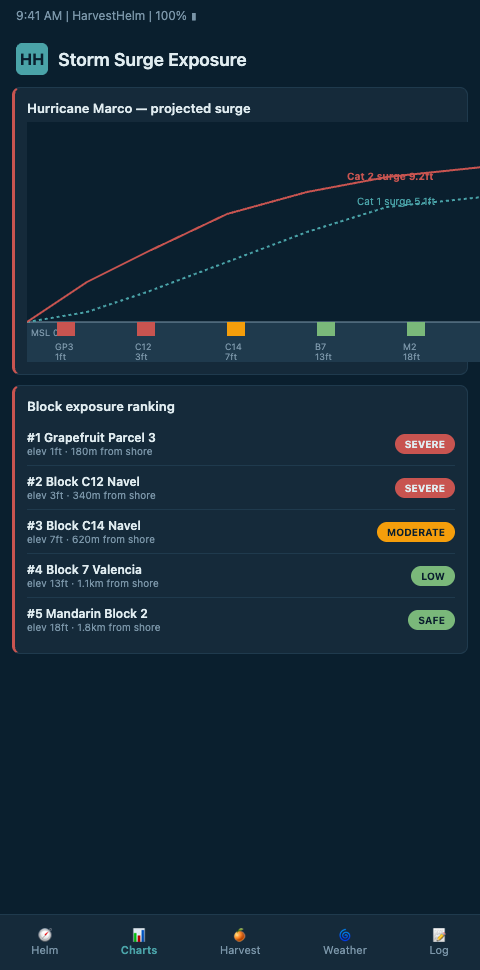
HarvestHelm ingests both products and overlays them on your navel orange block map as a helm-charted yield forecast. The nautical dashboard doesn't show surge as a single flood-or-safe gauge — it shows the vessel's keel depth relative to each block's elevation, so the captain can steer harvest and evacuation decisions block by block. The helm-chart mental model matters here because surge is not a single gauge value; it's a time-series of water levels that rises, plateaus, and drains across hours. A captain steering through a rising tide doesn't look at a single number — they look at the trajectory, the rate of change, and the predicted turn. The same logic applies to surge at the grove. HarvestHelm shows the captain the predicted surge trajectory for each block, the expected turn time, and the drainage decay curve. For each block the system computes:
- Surge-depth expectation under the inner-cone, outer-cone, and high-intensity scenarios.
- Saturation duration probability — the hours-saturated curve is where damage lives, not the peak depth.
- Rootstock-specific tolerance overlay — Swingle and Sour Orange handle short saturation differently.
- Phytophthora pressure index — blocks with existing Phytophthora detection get flagged for pre-emptive recovery staging.
The methodology underneath the SLOSH grid, documented in the Zachry 2015 national risk paper, treats surge as a spatially explicit field with friction, bathymetry, and wind-stress terms (SLOSH Zachry 2015: National View of Storm Surge Risk). HarvestHelm respects that field — it does not average surge across a grove. It scores each block as its own lane on the helm chart.
The charting practice treats each block as a miniature port — bathymetry at the block edge, drainage geometry in the block interior, elevation at the tree-trunk level, and rootstock-specific saturation tolerance for the trees planted there. When the captain looks at the helm chart, each block reads as its own harbor with its own flood-risk score. Captains with experience in coastal planning say this block-harbor mental model is the single insight that most changes how they organize evacuation and staging — the grove is not one boat; it's a fleet, each vessel with its own waterline.
A concrete example. A 100-acre coastal Navel operation with 14 blocks arranged across an east-to-west gradient from the estuary inland. HarvestHelm runs the SLOSH Category 3 scenario and produces per-block numbers: blocks 1 through 4 (closest to water) show surge depths of 4-6 feet and saturation durations above 72 hours; blocks 5 through 8 (mid-gradient) show surge depths of 1-2 feet with 24-48 hour saturation; blocks 9 through 14 (interior) stay above surge or dry within 12 hours. The chart then overlays rootstock-specific saturation tolerance.
Blocks 1 through 4 on Swingle face near-certain root damage; the same blocks on Sour Orange face partial loss. The captain's decision tree is now: protect blocks 5 through 8 with drainage preparation, write off blocks 1 through 4 as expected losses, and allocate all recovery resources to the mid-gradient blocks where intervention produces the most saved yield. That ranking drops straight into the evacuation priority list so crew staging follows the same block sequence the exposure map produced.
Advanced Tactics: From Exposure Map to Operational Playbook
A map without an action chain leaves growers worse off than they started. The exposure map is only useful if it drives three operational artifacts: a crew-and-equipment staging order built from the block surge ranking, a windbreak row planning audit that checks first-line exposure against surge topography, and a post-storm recovery sequence that targets the highest-saturation blocks first.
The pattern of using pre-event topography to drive grove-specific decisions carries across arid and humid geographies alike — desert grove operators reading haboob arrival signals apply the same fragmentation logic to their wadi maps. The signal type differs; the operational discipline is the same.
Edge cases where growers most commonly lose blocks:
- Muck-soil blocks below a rise. SLOSH may underpredict the local pond that forms behind a road embankment.
- Drainage canals at capacity upstream. Even modest surge backs up canals and holds water in blocks that nominally sit above surge height.
- Post-Ian Phytophthora carryover. Blocks flagged in prior years as infected collapse faster in the next saturation event — that history must be on the helm chart.
- Young tree plantings. Newly planted navel orange rows tolerate saturation for fewer hours than mature blocks.
HarvestHelm handles these cases by tagging each block with recovery-time estimates alongside surge-depth estimates. The recovery-time estimate is the captain's key decision variable post-storm — a block with a 48-hour recovery profile gets different triage than one with a 120-hour profile, and the allocation of pump capacity, crew attention, and replanting budget follows directly from the recovery curves on the chart.
A final tactic: treat the surge exposure map as a seasonal document, not a one-time plan. Each Atlantic season moves the cone differently, shifts the rainfall-runoff coupling, and — across multi-year spans — reshapes bathymetry and canal capacity. The helm chart re-runs the surge analysis at the start of each season against updated SLOSH data and updated grove conditions. Growers who treat the map as static lose the benefit of the reprocessing cycle; HarvestHelm's dashboard flags the delta since last season so the captain can see what moved and why.
Cross-season pattern learning sharpens the chart further. A grove that has logged post-storm recovery outcomes over several seasons produces a grove-specific damage-function that outperforms the generic SLOSH projection. Blocks that consistently outperform the SLOSH prediction get weighted as more surge-resilient; blocks that underperform get weighted as more vulnerable and receive higher priority for drainage upgrades or rootstock replanting. HarvestHelm captures that history automatically and feeds it into the forecast so the chart reflects the grove's actual response rather than only the model's expected response. Multi-season data is expensive to collect — and extremely valuable once collected.
Surge exposure also interacts with forward-contract decisions. A grove that has documented block-level surge exposure can price its forward contracts more accurately because it knows which blocks are likely to be compromised under a given hurricane season. Juice plants and fresh-market buyers are increasingly willing to work with surge-informed pricing — flat pricing penalizes conservative growers, and buyers who want reliable supply reward growers who can show them defensible surge projections. HarvestHelm's exposure map exports cleanly into the broker conversation so the surge data becomes commercial currency rather than only a defensive planning tool. The coastal operations that master this translation are the ones who lock in premium forward pricing even in active hurricane seasons, because their buyers trust the underlying risk accounting.
Get Early Access to the Coastal Citrus Grove Dashboard
Florida navel orange growers from St. Lucie County down through Hendry and Collier are running the HarvestHelm beta ahead of the next Atlantic season. If you farm blocks with mixed elevation and need surge exposure and post-storm Phytophthora priority on a single helm chart, join the Coastal Citrus Grove waitlist. Send us your block map, rootstock mix, and your last-three-storm recovery notes — we'll calibrate your exposure layer before the next advisory cycle drops. Operations joining the March cohort receive SLOSH v4 overlay calibration against their parcel bathymetry plus canal-capacity upstream analysis before June, so pump deployment orders are pre-ranked by block saturation duration rather than guessed during the storm.
Day one of your helm chart shows per-block surge-depth expectation under three cone scenarios, the hours-saturated curve where Phytophthora damage actually lives, and rootstock-specific tolerance overlays for Swingle versus Sour Orange differentials. Navel-heavy operations with canal-fed drainage see the upstream backup physics — surge plus canal saturation compounding — rendered on one chart lane so the 14-block prioritization runs in seconds rather than a week of spreadsheet reconciliation. Groves with prior Phytophthora flags get those blocks weighted into the recovery-time estimates immediately, with replant-budget projections attached so the 4-5 year production gap on catastrophic blocks feeds capital planning before the next advisory cycle.