When Wind-Driven Salt Masks True Frost Damage Signals
The January 2023 Misdiagnosis
A St. Lucie County grove walked into February 2023 convinced they had a textbook radiational frost event. The symptoms matched: tan-brown leaf patches, edge scorch on southern-exposed canopy, and scattered leaf drop two weeks after a cold front passed with temperatures reported in the low 30s Fahrenheit. They applied their frost-recovery protocol — dormant spray adjustments, bud-break timing recalculation, pruning strategy shift — and lost 18 months of planning because the diagnosis was wrong.
When spring arrived, the blocks that should have recovered on the frost-recovery schedule showed delayed bud-break, thin initial flush, and fruit-set rates 35 to 45 percent below the historical block average. The salt that had actually caused the damage was still in the root zone, compounding with every irrigation cycle that did not include a leaching component. By the time lab analysis confirmed the salt origin, the misdirected frost-recovery protocol had cost the grove two cycles of productive planning and a meaningful chunk of the following season's yield.
The actual cause was wind-driven salt. A 36-hour onshore flow two days before the cold front had pushed salt aerosols into the Valencia blocks, and the cold front's dry air accelerated leaf-surface moisture loss, concentrating the deposited salt at leaf edges. Wind Burn & Salt Damage: Help Your Plants Recover Fast documents how salt burn starts at leaf edges and turns rusty brown, visually overlapping with cold scorch. Boron (B) and Chlorine (Cl) for Citrus Trees (UF/IFAS EDIS SS619) adds the diagnostic detail: chloride toxicity necrosis starts at leaf tips and progresses down edges, producing a symptom-pattern signature that mimics frost scorch. Groves running the full salt ingress signals ladder rarely misdiagnose an event like this because the EC-climb signal preceded the cold front by days.
Winter Salt Injury and Salt-tolerant Landscape Plants (Wisconsin Horticulture) documents the compound problem: salt spray exposure increases winter injury susceptibility, so the two hazards interact rather than substitute. A grove experiencing both a salt event and a cold event can have overlapping damage signatures that defeat visual diagnosis alone.
Helm-Charted Separation: Temporal, Spatial, and Physiological Signals
HarvestHelm separates frost from salt damage using three signal dimensions that grove telemetry captures but visual inspection misses. The helm-charted yield forecast overlays temperature history, wind-direction history, and salt-conductivity sensor traces on the block map so the cause-of-damage attribution has objective data rather than just morphology.
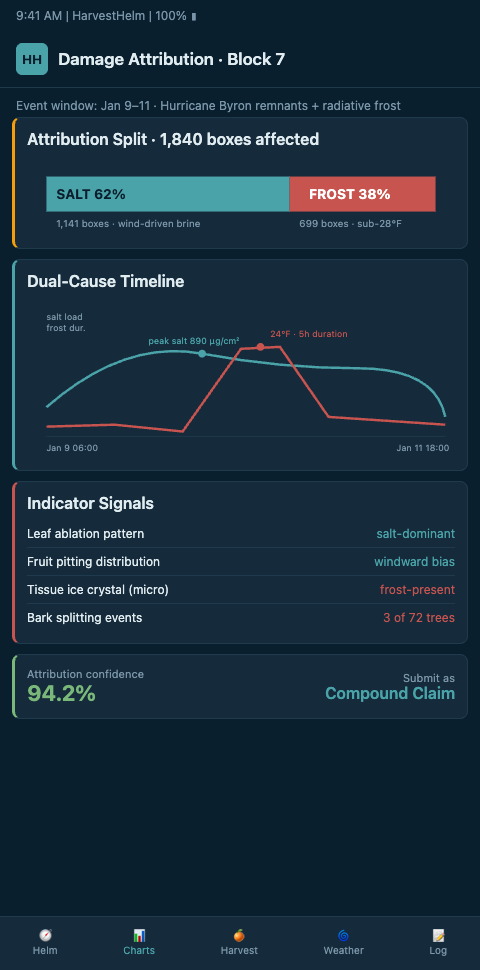
Temporal signal: when did the hazard event happen relative to the symptom onset? Frost injury produces water-soaked leaf patches followed by tan/brown bleaching within 24 to 72 hours, while salt damage typically develops over 5 to 14 days as the ion load accumulates in leaf tissue. HarvestHelm cross-references timestamped sensor data against symptom-photo logs to establish the temporal fit. A grove reporting new symptoms 10 days after a cold front but only 3 days after an onshore salt event should not attribute damage to the front.
Spatial signal: is the damage pattern consistent with frost or with salt? Frost damage distributes uniformly across the canopy or concentrates in cold-air drainage zones — low spots, valley floors, north-facing slopes. Salt damage concentrates on the windward-facing canopy, with a sharp gradient away from the coast or the upwind direction of the salt event. Shoreline wave breaking enhances coastal sea spray aerosol (Science Advances) quantifies the shore-front aerosol enrichment that creates asymmetric leaf-burn gradients distinguishable from frost-driven patterns.
Physiological signal: what is the chloride and sodium content of the damaged leaves? This is the definitive diagnostic, and it requires lab testing. HarvestHelm auto-flags damaged blocks for leaf-sampling and routes the samples through a tracking workflow so growers receive lab results tied back to the specific block and symptom-onset date. Sodium toxicity shows leaf bronzing and older-leaf scorch patterns distinct from frost symptom sequences, and lab chloride values above 0.5 to 0.7 percent leaf dry weight confirm salt over frost.
The three signals together produce a diagnosis that visual inspection alone cannot. Growers who trust only the morphology are gambling on the dominant hazard — and in coastal groves, that dominant hazard is often mixed.
Advanced Tactics: Pre-Event Sensor Baselines and Hybrid Damage Decomposition
The tactical advantage of the sensor network is pre-event baseline. If your grove has three days of pre-event salt-conductivity readings and three days of pre-event temperature logs, the post-event attribution is clean. Growers who deploy sensors only during active hurricane tracks miss the cold-front events where the diagnostic work is subtler. HarvestHelm recommends continuous year-round sensor operation for coastal groves inside 20 miles of the coast, regardless of active-track status, because the cold-front-plus-salt combination plays out outside the hurricane season.
Hybrid damage decomposition is the frontier. A block that experiences both a 28-degree cold event and a 180 ppm-hour salt-aerosol event within a two-week window has damage with both causes. HarvestHelm's decomposition model attributes proportional leaf loss to each cause based on the block's rootstock salt tolerance, the measured cold exposure, and the observed damage distribution. The decomposition matters for insurance claims — HIP-WI triggers on wind events, APH policies may or may not cover frost damage depending on policy structure, and claim documentation that separates the two causes helps adjusters allocate payout correctly.
Upstream: catching salt damage at the early ingress stage before leaf drop begins narrows the visual-diagnosis ambiguity substantially. Growers running active salt-ingress monitoring rarely misdiagnose a salt event as a frost event because the EC-climb and canopy-differential readings preceded the cold front by days.
Related mitigation: our predictive brine mitigation playbook covers how to reduce the salt burden that creates the masking problem in the first place — a grove with 40 percent less deposited salt has proportionally less salt-frost confusion.
Cross-niche pattern: mountain apple growers face a different masking problem with false-positive frost alerts on south-facing slopes where thermal behavior differs from the grove-wide average. The diagnostic principle is the same — use the sensor network to correct what visual inspection biases.
Training matters. Walk damaged blocks with lab results in hand. Over two seasons, your field team develops the ability to pre-classify damage type before lab confirmation, which compresses the decision-to-action timeline during active events.
Leaf-Drop Timing as the Forensic Tiebreaker
When temporal and spatial signals conflict, leaf-drop timing often resolves the ambiguity. Frost-damaged leaves tend to drop within 3 to 14 days of the cold event, driven by abscission-layer activation from the vascular damage, matching the timeline in Freeze Damage Symptoms and Recovery for Citrus (UF/IFAS EDIS HS1275). Salt-damaged leaves often drop 2 to 6 weeks later because the ion accumulation injures tissue progressively rather than all at once. Freezing and Frost Damage to Citrus (UC IPM) notes that ice-formation damage produces different leaf-drop signatures than osmotic damage, and HarvestHelm logs leaf-drop rates per block daily during recovery periods so the curve shape distinguishes frost-pattern from salt-pattern even when the initial symptom onset was ambiguous.
Bud-break behavior the following season is the final tiebreaker. Frost-damaged wood that survives the current season often shows normal bud-break timing and pattern the following spring, because the damage did not reach vascular tissue. Salt-damaged blocks often show delayed bud-break and thinner initial flush because the residual soil chloride continues affecting root physiology through the winter. HarvestHelm tracks bud-break dates and flush density as a validation layer for prior-season damage attribution.
These forensic indicators also feed the insurance-claim workflow. An adjuster reviewing a brine-damage claim appreciates leaf-drop curve data and bud-break observations as corroborating evidence for the cause-of-damage attribution. Our evidence chain for USDA filings includes the leaf-drop timing series as standard documentation.
Grove-Specific Misdiagnosis Patterns
Every coastal grove develops characteristic misdiagnosis patterns based on its geography. Groves on barrier islands tend to over-attribute damage to frost because the maritime moderation of temperature makes salt events feel unlikely in grower intuition. Inland groves 15 to 25 miles from the coast often over-attribute damage to salt because recent hurricane memory biases the interpretation of any winter damage.
HarvestHelm builds a grove-specific diagnostic history over time. After two seasons of logged damage events with lab-confirmed attribution, the model learns which visual patterns in which blocks historically indicate which cause. Field crews using the dashboard during damage walks get a probability-weighted pre-classification before the lab samples even ship.
This grove-specific learning matters more than any generic guidance. Two groves 8 miles apart can have different damage-attribution probability distributions because local topography, prevailing wind patterns, and canopy architecture interact. HarvestHelm's model adapts per grove rather than applying a regional average.
Compounding Effects When Events Overlap
The most difficult diagnostic case is when salt and frost events overlap within days. A coastal cold front can carry both sub-freezing air and an onshore wind component that pushes salt aerosol ahead of the frontal passage. The resulting damage combines frost vascular injury with salt foliar burn, producing symptom patterns that match neither pure-frost nor pure-salt reference patterns.
HarvestHelm's decomposition model handles the overlap by attributing proportional damage based on the block's rootstock, the sensor-measured temperature minimum, and the sensor-measured salt-deposition integral. A 28-degree minimum combined with a 90 ppm-hour salt event on Cleopatra rootstock produces a different damage attribution than the same temperatures on Swingle rootstock. A Guide to Citrus Nutritional Deficiency and Toxicity (UF/IFAS EDIS CH142) is the UF/IFAS field reference that confirms the sodium-bronzing pattern the decomposition model uses as corroborating evidence. The attribution feeds into both the recovery plan (different mitigation for each component) and the insurance-claim workflow (different policy layers may trigger on each component).
Recovery resource allocation depends on the decomposition. A block where damage is 70 percent salt and 30 percent frost needs aggressive leaching irrigation and fresh-water rinse for the salt component; the frost component may only need minor pruning and time. Mis-decomposition leads to mis-allocation — growers who treat a mixed event as pure frost often skip the leaching that would have rescued the salt-damaged root zone.
Use the Sensor Network to Get the Diagnosis Right the First Time
Coastal Valencia, Hamlin, Murcott, and Navel growers cannot afford 18-month bud-break plans built on misdiagnosed damage. HarvestHelm separates wind-driven salt damage from true frost injury using temporal, spatial, and physiological signals from the grove sensor network, routing damaged blocks through lab-sampling workflows automatically and feeding the results back into the helm-charted yield forecast. Zero platform fee. The kilo-cut on successful harvest keeps the tool aligned with recovery plans that target the actual damage, not the mistakenly-assigned damage. Operations joining before the December-February cold-front window get continuous year-round salt-conductivity baselines established across 90 days so the cold-plus-salt decomposition model can attribute proportional damage on the first overlapping event. Day one of your dashboard shows the three-signal separation per block — temporal fit against sensor timestamps, spatial gradient rendered across windward versus cold-drainage zones, and leaf-Cl lab-tracking tickets.