Building a Climate-Drift Model for Variable Date Fruit-Set Rates
Why Fruit-Set Variance Is the Real Signal
When a Biskra or Coachella Valley grower reports that their fruit set "has become unpredictable" over the last decade, they're describing a statistical property, not a folk impression. The historical distribution of fruit-set outcomes across a mature Medjool or Deglet Noor operation used to center around a 62-68% mean with a standard deviation of 4-6 percentage points. Over the last eight to ten seasons, that same operation often reports a mean closer to 58-63% with a standard deviation of 8-11 points. The mean drifted; the variance widened. Both changes matter, and they compound.
The IPCC AR6 Africa regional fact sheet documents African surface warming exceeding the global average, which directly loads into the diurnal envelope that drives date palm physiology. The ResearchGate paper on climate change impacts on date palm cultivation in Saudi Arabia predicts Saudi warming of 2°C by 2030 and 2.5-3.5°C by 2050, with explicit range contraction for date palm suitability. The PLOS ONE CLIMEX modeling framework projects MENA date palm suitability shifts under climate scenarios, and those shifts are dominated by pollination-window and fruit-set variance rather than by absolute heat.
The operational consequence is that a grower planning the next three seasons of pollen purchases, crew contracts, and packing-line throughput from the historical mean fruit-set is systematically over-optimistic. They're budgeting for an outcome distribution that has shifted left and widened. The right response is not pessimism — a catastrophic fruit-set forecast will just get ignored — but a model that explicitly quantifies drift and variance and delivers a probability distribution rather than a point estimate.
The Helm-Charted Yield Forecast With Climate-Drift Integration
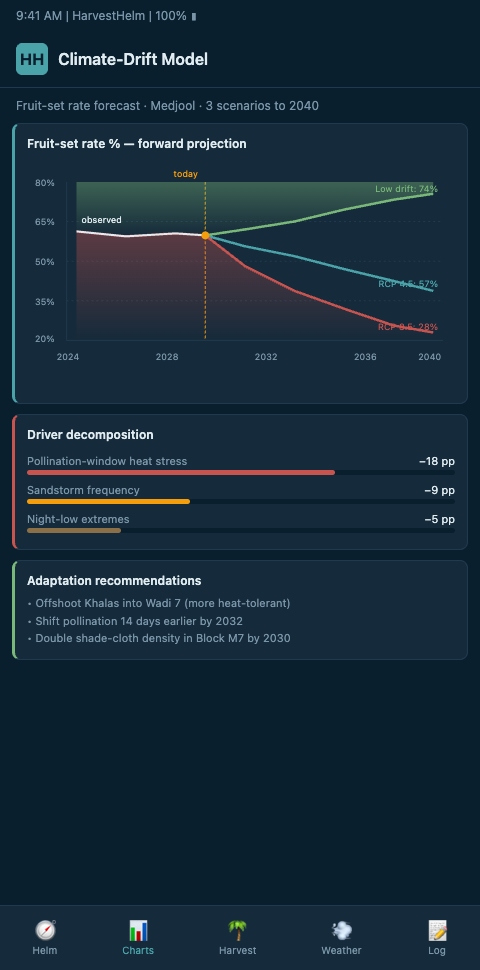
HarvestHelm's helm-charted yield forecast integrates climate drift as a first-class input alongside real-time telemetry. The yacht dashboard shows a grower the current season's projected fruit-set as a distribution, with the central estimate, a drift-adjusted median, and explicit probability bands for poor/normal/strong outcomes. This is not pessimism surfaced as a forecast; it's calibration. A captain does not pretend the currents haven't shifted — they read the updated charts and adjust their heading accordingly.
The model's architecture has four components. First, we ingest IPCC AR6 physical science basis data at regional downscale for the specific oasis latitude. Second, we fit a regression of fruit-set rates against diurnal envelope parameters — day-max, night-min, heat-unit accumulation, stress-hour counts — calibrated against the grower's own historical record. Third, we condition the regression on the IPCC warming trajectory to project forward 1, 3, and 5 seasons. Fourth, we update continuously: every new telemetry week refines the parameters, so a forecast made in December for next March's bloom tightens its confidence interval as the season approaches.
The ScienceDirect study on date palm stress tolerance and genetic diversity summarizes physiological thresholds that constrain the regression — fruit set has physical limits, and the drift model respects those. The ScienceDirect acclimation study on heat and drought in date palm documents photosynthetic acclimation ceilings that determine the upper boundary of adaptive response. The helm respects those ceilings as model priors — we don't extrapolate into physiologically impossible territory, which is a common failure mode in purely statistical climate-drift models.
The Kimri-stage preharvest fruit drop study on Deglet Nour documents that kimri-stage drops accelerate under widening day-night temperature gaps — a specific physiological pathway the climate-drift model must capture. The ScienceDirect paper on climate change projections for MENA with COSMO-CLM provides high-resolution regional climate projections that drive the downscaled forcing. Together these inputs produce a fruit-set distribution that's calibrated both to climate forcing and to the cultivar-specific physiological chain that translates forcing into yield.
The practical output matters operationally. A Tozeur grower who historically budgeted 64% fruit set for 2026 Deglet Noor might see the helm forecast a drift-adjusted median of 59% with a 90% confidence band running from 48% to 68%. That spread drives real decisions: pollen inventory sized to the 68% case hedges the upside while crew capacity sized to the 48% case caps the downside. We cover the diurnal-drift foundation that drives this in our post on multi-season diurnal drift, and the model's output feeds directly into the precision pollination future planning horizon.
Advanced Tactics: Making the Drift Model Operationally Real
The first advanced move is ensemble weighting. Any single climate projection carries its own structural biases. We run the fruit-set forecast against five IPCC-consistent downscaled projections and weight their outputs by backcast performance against the specific oasis's historical temperature record. Projections that recreated 2015-2024 MENA temperature patterns accurately get higher weight on forward forecasts; projections that missed the 2022 MENA dust event sequence get reduced weight. This ensemble discipline produces forecasts that are robust to single-model error in ways a best-guess single projection cannot be.
The second tactic is physiological-pathway decomposition. The climate-drift model doesn't produce a single scalar fruit-set number — it decomposes the prediction into pollination-window fit, stigma-receptivity overlap, temperature-stress during receptivity, sandstorm exposure during receptivity, and kimri-stage thermal stress. Each pathway has a distinct operational intervention. If the forecast shows the fruit-set reduction is 70% driven by kimri-stage thermal stress rather than pollination misalignment, the grower's response is different — it's a shade-management and irrigation response rather than a pollen-logistics response. Decomposing the drift signal into pathways makes the forecast actionable, not just descriptive.
The third tactic is cross-crop calibration sharing. The climate-drift engineering transfers across perennials. Our equivalent disease pressure futures work for tropical mango plantations applies the same regression-and-downscaling architecture to humidity-driven fungal pressure rather than temperature-driven fruit-set. A statistical discipline proven on mango anthracnose pressure transfers into date fruit-set modeling as a corroborated method rather than a speculative one. This multi-niche validation gives growers reason to trust the model beyond what a single-crop deployment would justify.
The fourth tactic is explicit drift-rate reporting. The helm's yacht dashboard displays, alongside the fruit-set forecast, the current drift rate for the oasis — typically expressed as °C per decade for night-low, °C per decade for day-max, and drift in days per decade for spathe emergence. These drift rates update continuously as new telemetry accumulates. A grower seeing their night-low drift accelerate from -0.4°C/decade to -0.8°C/decade knows to expect larger fruit-set variance in coming seasons and can plan pollen inventory and crew contracts accordingly. Making drift legible on the dashboard — not buried in a statistical appendix — is what turns a climate model into an operational tool.
The fifth tactic is grower-specific calibration priors. A new grower onboarding to HarvestHelm with only 18 months of their own data starts with region-wide climate-drift priors and gradually transitions to grower-specific priors as their historical telemetry accumulates. The yacht dashboard explicitly shows this transition — "Your forecast is 40% grower-specific, 60% regional prior" in year one; "Your forecast is 85% grower-specific, 15% regional prior" by year four. Transparency about the forecast's data foundation is how we avoid false precision.
The sixth tactic is intervention-sensitivity propagation. The climate-drift model explicitly supports what-if analysis against operational interventions. A grower considering whether to install shade-cloth over a fifth of their Deglet Noor blocks can ask the helm: given the projected 2026-2028 drift scenario, how does shade cloth shift the fruit-set distribution? The model returns a quantitative estimate — say, 3.2 percentage points of expected fruit-set gain with 1.8 percentage points of variance reduction — that supports the capital decision on its actual merits. Without drift-aware projection, the grower is evaluating the shade cloth against this year's weather, which misses the whole point of the investment.
The seventh tactic is cultivar-reassignment decision support. Climate drift eventually pushes some cultivars out of physiological viability in specific oasis locations. The helm tracks each cultivar's expected fruit-set distribution under projected drift scenarios and flags cultivar-parcel combinations where median fruit set is projected to drop below a grower-defined threshold over the next 5-10 seasons. That flag does not mean immediate replanting — replanting a date palm is a decade-long commitment — but it does mean the grower should factor cultivar drift into offshoot-planting decisions this year. Our cultivar reassignment advisory uses the drift model as its core input, coupling climate projection to physical planting strategy in a way that generic climate reports cannot.
The eighth tactic is insurance-premium negotiation support. When an insurance renewal cycle approaches, a grower with a calibrated drift model can present underwriters with a grower-specific fruit-set distribution rather than relying on the underwriter's regional prior. In cases where the grower's specific operation has lower variance than the regional assumption, this documentation supports a premium reduction. In cases where it's higher, the grower at least understands the true risk and can price production contracts accordingly. The drift model is an underwriting-grade data asset, not just an internal planning tool.
Forecast Variance, Not Just Means
If your fruit-set budgets are built from the 10-year average and you've noticed reality drifting further from that average each season, your forecast isn't measuring what matters. HarvestHelm builds a climate-drift model that quantifies your oasis's specific drift rate across day-max, night-low, and spathe-emergence axes, conditions your fruit-set forecast on that drift, and delivers a probability distribution rather than a point estimate — so you can budget for the realistic range of outcomes rather than a single optimistic guess. Because our kilo-cut pricing earns only on successful harvest tonnage, we have every reason to forecast the variance honestly — over-optimism costs us, not you.
If you're planning 2026-2028 pollen contracts, crew capacity, or packing-line upgrades for Medjool, Deglet Noor, Barhi, or Zahidi blocks, let us run your oasis's drift model and show you the distribution of fruit-set outcomes your next three seasons are actually looking at. Join the climate-drift waitlist before your next bunch-thinning season, and on day one the dashboard will surface your fruit-set distribution decomposed by physiological pathway — pollination-window fit, stigma-receptivity overlap, khamsin exposure, and Kimri-stage thermal stress — with per-intervention sensitivity estimates. Waitlisted Biskra and Coachella operators who ran the drift model ahead of last bloom identified that 71% of their Deglet Noor fruit-set reduction traced to Kimri thermal stress rather than pollination gaps, redirecting their intervention budget toward shade-cloth rather than additional pollen.